Working with us
Metabolon’s solution ensures the maximum value, utility, and applicability of your data to advance your research objectives. We offer end-to-end service for all our products, from study design to data reporting.
Data interpretation is tiered depending on client needs. Every tier includes the Client Data Table (CDT). The CDT is a collection of data deliverables to help clients review, analyze, and understand their project data. The format makes it easy to import study data into popular analysis and statistical tools, such as R or Python, with a consistent format. Every project includes full metabolite data in Excel format.
In addition to the Client Data Table, absolute quantitative measurements are provided as part of a sample analysis report with a description of reference chemicals and matrices used during sample analysis. If the Targeted Panel is part of a Discovery study, statistics and interpretation may be provided. Custom panels and assays include a final assay protocol and method validation report.
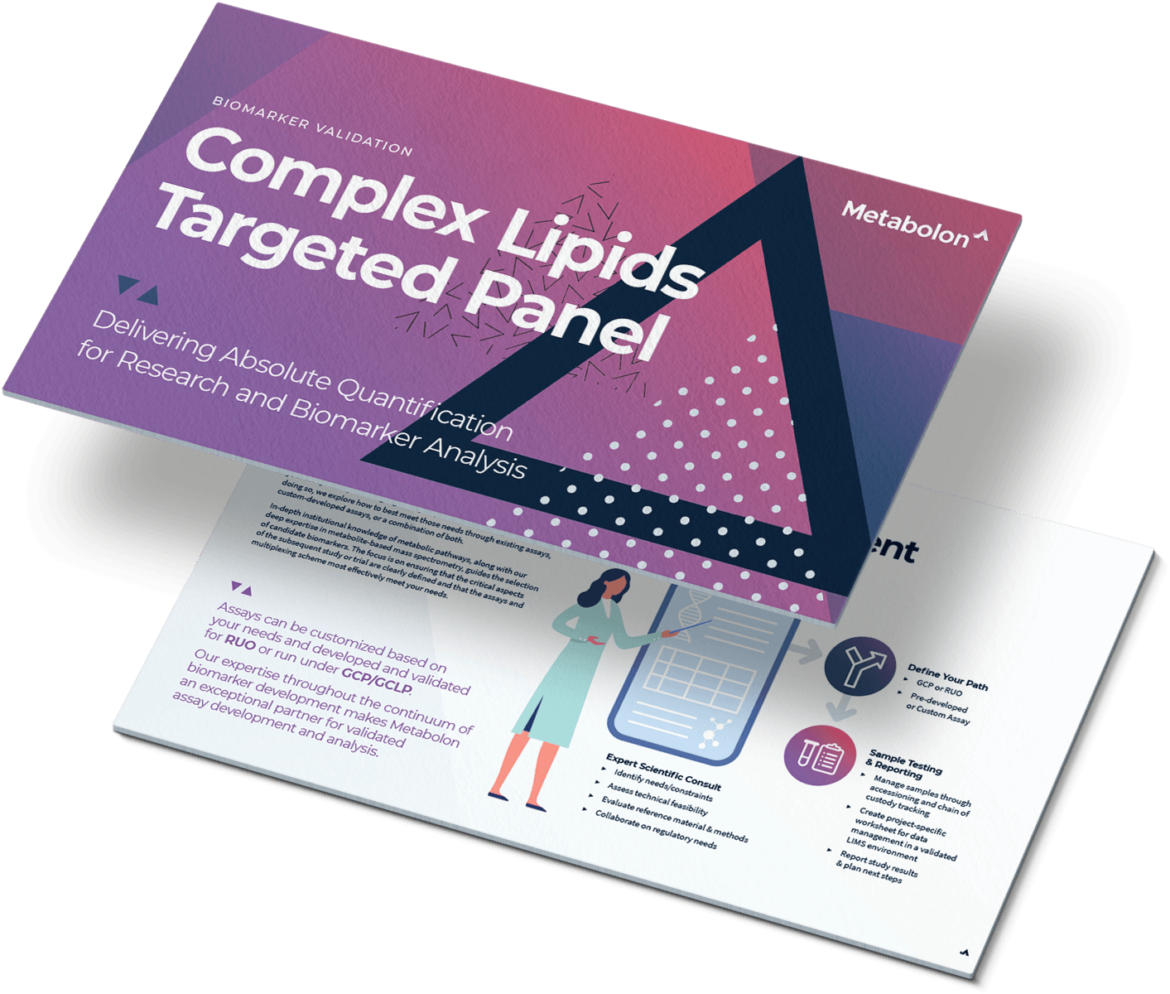
In addition to the CDT, the Complex Lipids Targeted Panel also comes with access to Surveyor, a suite of custom-designed data visualization and analysis software tools. Two primary tools exist within Surveyor for interpreting the data—Pathway Mapping Tools and Discovery Tools.
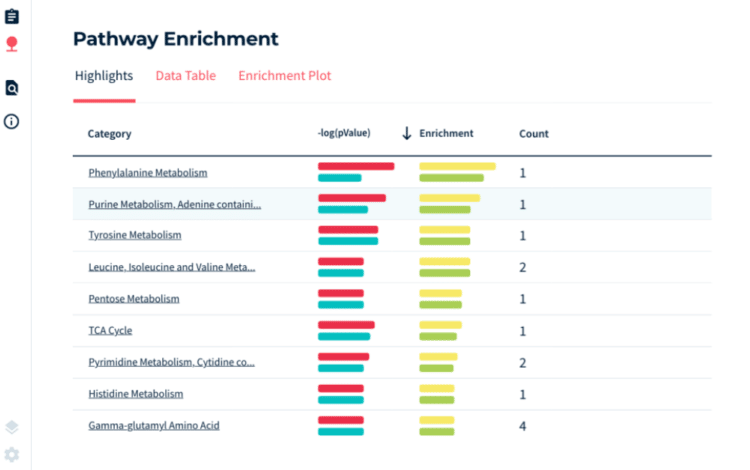
The Surveyor pathway maps allow clients to understand their lipidomic data in the context of lipid metabolic pathways. Each pathway has been curated and annotated by Metabolon experts, and each element of the map is interactive, providing both data analysis (boxplots and difference testing) and additional information on each metabolite or activity. Using Pathway Mapping tools, researchers can investigate the effect of their comparisons on the concentration and fatty acid composition of different pathways, including:
Discovery tools allow clients to perform an unbiased evaluation of the performance of each lipid and layer in biological information and structure when desired. The tools plot all of the measured lipids and allow clients to filter and sort results to aid in the identification of biomarkers. The Biomarker Performance page provides a comprehensive view of the performance of each lipid marker in separating the treatment groups. The Time Course/Multiple Comparisons page improves the analysis of time-course and multiple-treatment comparisons by allowing clients to simultaneously plot multiple comparisons between groups. In both tools, each plot point is interactive, linking a selected lipid marker to additional information about their structure and biology, including related box plots.
For projects that include a Discovery Panel, the CDT comprises three individual files with heat maps and box plots in separate Excel and pdf files. This video walks through examples of each of these files with attention focused on the features, layout, information, and the user benefits of each. In addition to the CDT, you may also add on a statistical analysis of your data with univariate significance tests (t-tests, ANOVA, repeated measures analysis, etc.) performed by our experienced informatics team. Statistics, along with heat maps and box plots, are viewable in the MyMetabolon client portal for visualizing and analyzing your study data.
Full custom interpretation by our experienced team of more than 20 PhD study directors is available for Discovery Panels, leveraging our proprietary biochemical pathway knowledgebase and powerful bioinformatics. Interpretation may include a comprehensive summary of actionable biological insights and recommended next steps. Your study may benefit from additional post-project support and a live consultation with your study director to help answer any questions and move forward with your research.
Once you see the full value of metabolomics, the only remaining question is: who does it best? While many laboratories have metabolite profiling or analytical chemistry capabilities, comprehensive metabolomics technologies are extremely rare.
Accurate, unbiased metabolite identification across the entire metabolome introduces signal-to-noise challenges that very few labs are equipped to handle. Also, translating massive quantities of data into actionable information is slow, if not impossible, for most because proper interpretation takes two things that are in short supply: experience and a comprehensive database.
Using our robust platform and visualization tools, our experts are uniquely able to tell you more about your molecule and develop assay panels to help you zero in on the results you need.
Coverage
Ability to interrogate thousands of metabolites across diverse biochemical space, revealing new insights and opportunities
Comparability
Ability to integrate the data from different studies into the same dataset, in different geographies, among different patients over time
Competency
Ability to inform on proper study design, generate high‐quality data, derive biological insights, and make actionable recommendations
Capacity
Ability to process hundreds of thousands of samples quickly and cost‐efficiently to service rapidly growing demand
Request a quote for our services, get more information on sample types and handling procedures, request a letter of support, or submit a question about how metabolomics can advance your research.
Corporate Headquarters
617 Davis Drive, Suite 100
Morrisville, NC 27560
Mailing Address
P.O. Box 110407
Research Triangle Park, NC 27709
Phone
+1 (919) 572-1711
Fax
+1 (919) 572-1721
International Headquarters
Metabolon GmbH
Zeppelinstraße 3
85399 Hallbergmoos
Germany