Bioinformatics
Principal Component Analysis (PCA)
PCA Overview
The Principal Component Analysis (PCA) is a valuable tool for exploring and interpreting complex metabolomics datasets, aiding in the identification of biologically relevant markers and the understanding of metabolic mechanisms. This intuitive tool allows you to easily investigate and visualize data to answer basic research questions and can serve as a starting point for researchers. The PCA tool offers customizable features to meet your needs and allows you to be autonomous in investigating data in line with your research goals.
Principal Component Analysis is a popular and useful linear transformation technique used in numerous applications including gene expression analysis and metabolomics studies. In metabolomics, where datasets are often high-dimensional and complex, PCA serves as a valuable tool for dimensionality reduction and data visualization. By reducing the data to its principal components, PCA helps in simplifying the dataset while retaining important information, making it easier for machine learning algorithms to process and analyze the data effectively.
One of the key benefits of PCA analysis is its unsupervised nature which makes it more straightforward in terms of parameterization. Unsupervised here refers to PCA not requiring labeled data. This means there is relative simplicity of the algorithm so that it may be computed on the platform initially and your key parameter is the number of components directly related to how much of the variance you wish to maintain in the reduced data.
PCA is often used as a preliminary step in data analysis and preprocessing for other machine learning tasks and enables visualization of high-dimensional data. While PCA itself may have few parameters, the preprocessing steps on the data like normalization and scaling can significantly impact its performance and the interpretation of the results. This is where Metabolon’s platform has great value as we have experts who have numerous years of experience applying statistical methods to ensure the input data to an algorithm like PCA is consistent.
Demo the Bioinformatics Platform
Explore, interpret, and elucidate the biological impact of your samples using publication-ready tools.
PCA within Our Bioinformatics Platform
The utility of PCA analysis has been incorporated into Metabolon’s Bioinformatics Platform. With this tool, you have control to better interpret and form hypotheses of the metabolomic profile from the study groups and identify patterns or metabolites of interest from the visualization and data exports.
Exploratory Data Analysis
PCA provides a first look at the main relationships in the data and observes highly correlated metabolomic profiles which may help with hypothesis generation and planning of more detailed analysis.
Visualization and Pattern Recognition
The reduced dimensions make it easier to visualize high-dimensional data in two or three dimensions. Using PCA makes it possible to visually distinguish between healthy and disease states based on the metabolomic profiles. By visualizing samples according to these principal components, you can more easily discern the underlying patterns, relationships, and clusters within the different samples. This visual representation aids in understanding the intrinsic structure of the data, highlighting how samples are related to each other in the reduced-dimensional space created by PCA.
Noise Reduction
Noise reduction filters out less informative metabolites by focusing on principal components with the highest variance and allows researchers to concentrate on the most significant features of the data.
Interpret and Visualize Computed Principal Components for Hypothesis Generation
Precomputed PCA analysis
Our platform does not require you to define any parameters for the initial PCA computation. Instead, up to 32 PCS are precomputed for you to pick and choose for comparison. The data is normalized before PCA is computed which is handled by the platform. The PCS are determined based on the data’s covariance matrix and do not change based on external criteria.
Customizable Visualizations
You have full control over the appearance of the plots from color schemes to font sizes of legends. The plots are interactive so you can pan, zoom, and select individual entities in plots. You may also export and save the plots that they have personalized. You may color and symbolize individual plots by study groups meaning the plots themselves may become very specific leading to hypothesis generation.
Exportable Tables
All data tables may be exported and downloaded including the dataset and the calculated principal components.
Principal Component Analysis (PCA) Features
Overview Feature
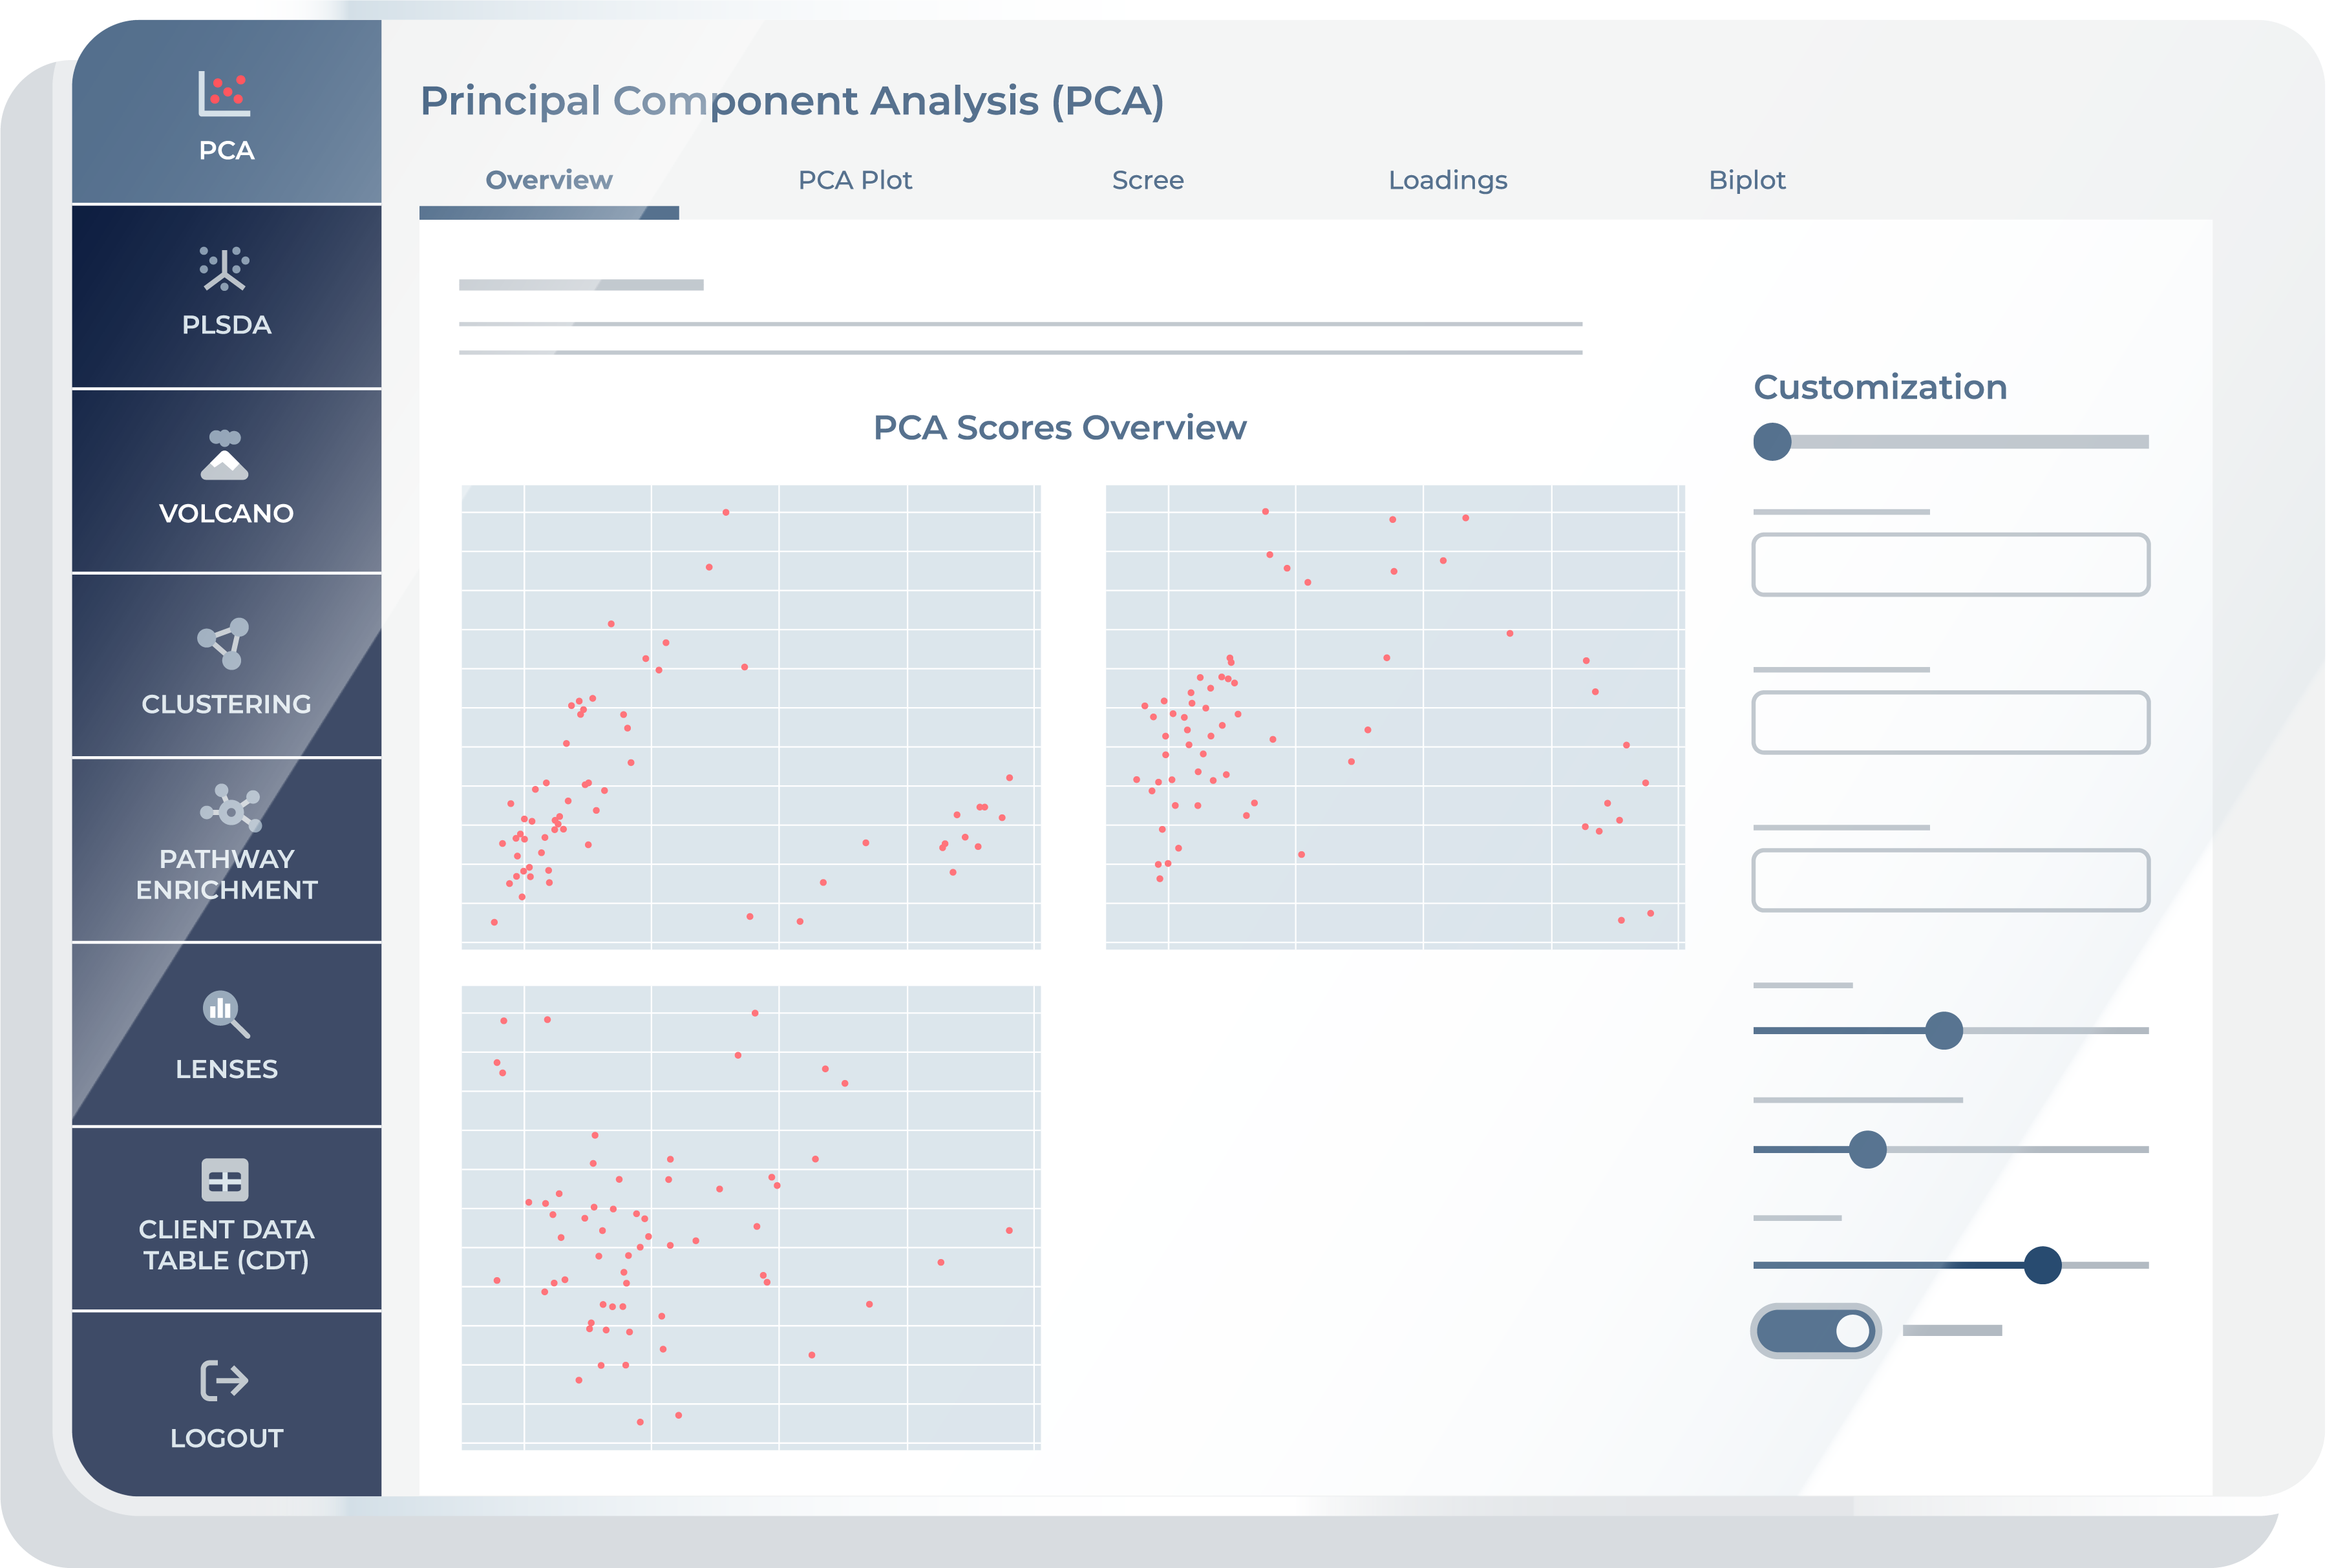
The “Overview” feature displays 2D scatter plots of samples projected onto pairs of Principal Components (PCs). These plots help you visualize the distribution and clustering of samples across different principal component combinations.
PCA Plot
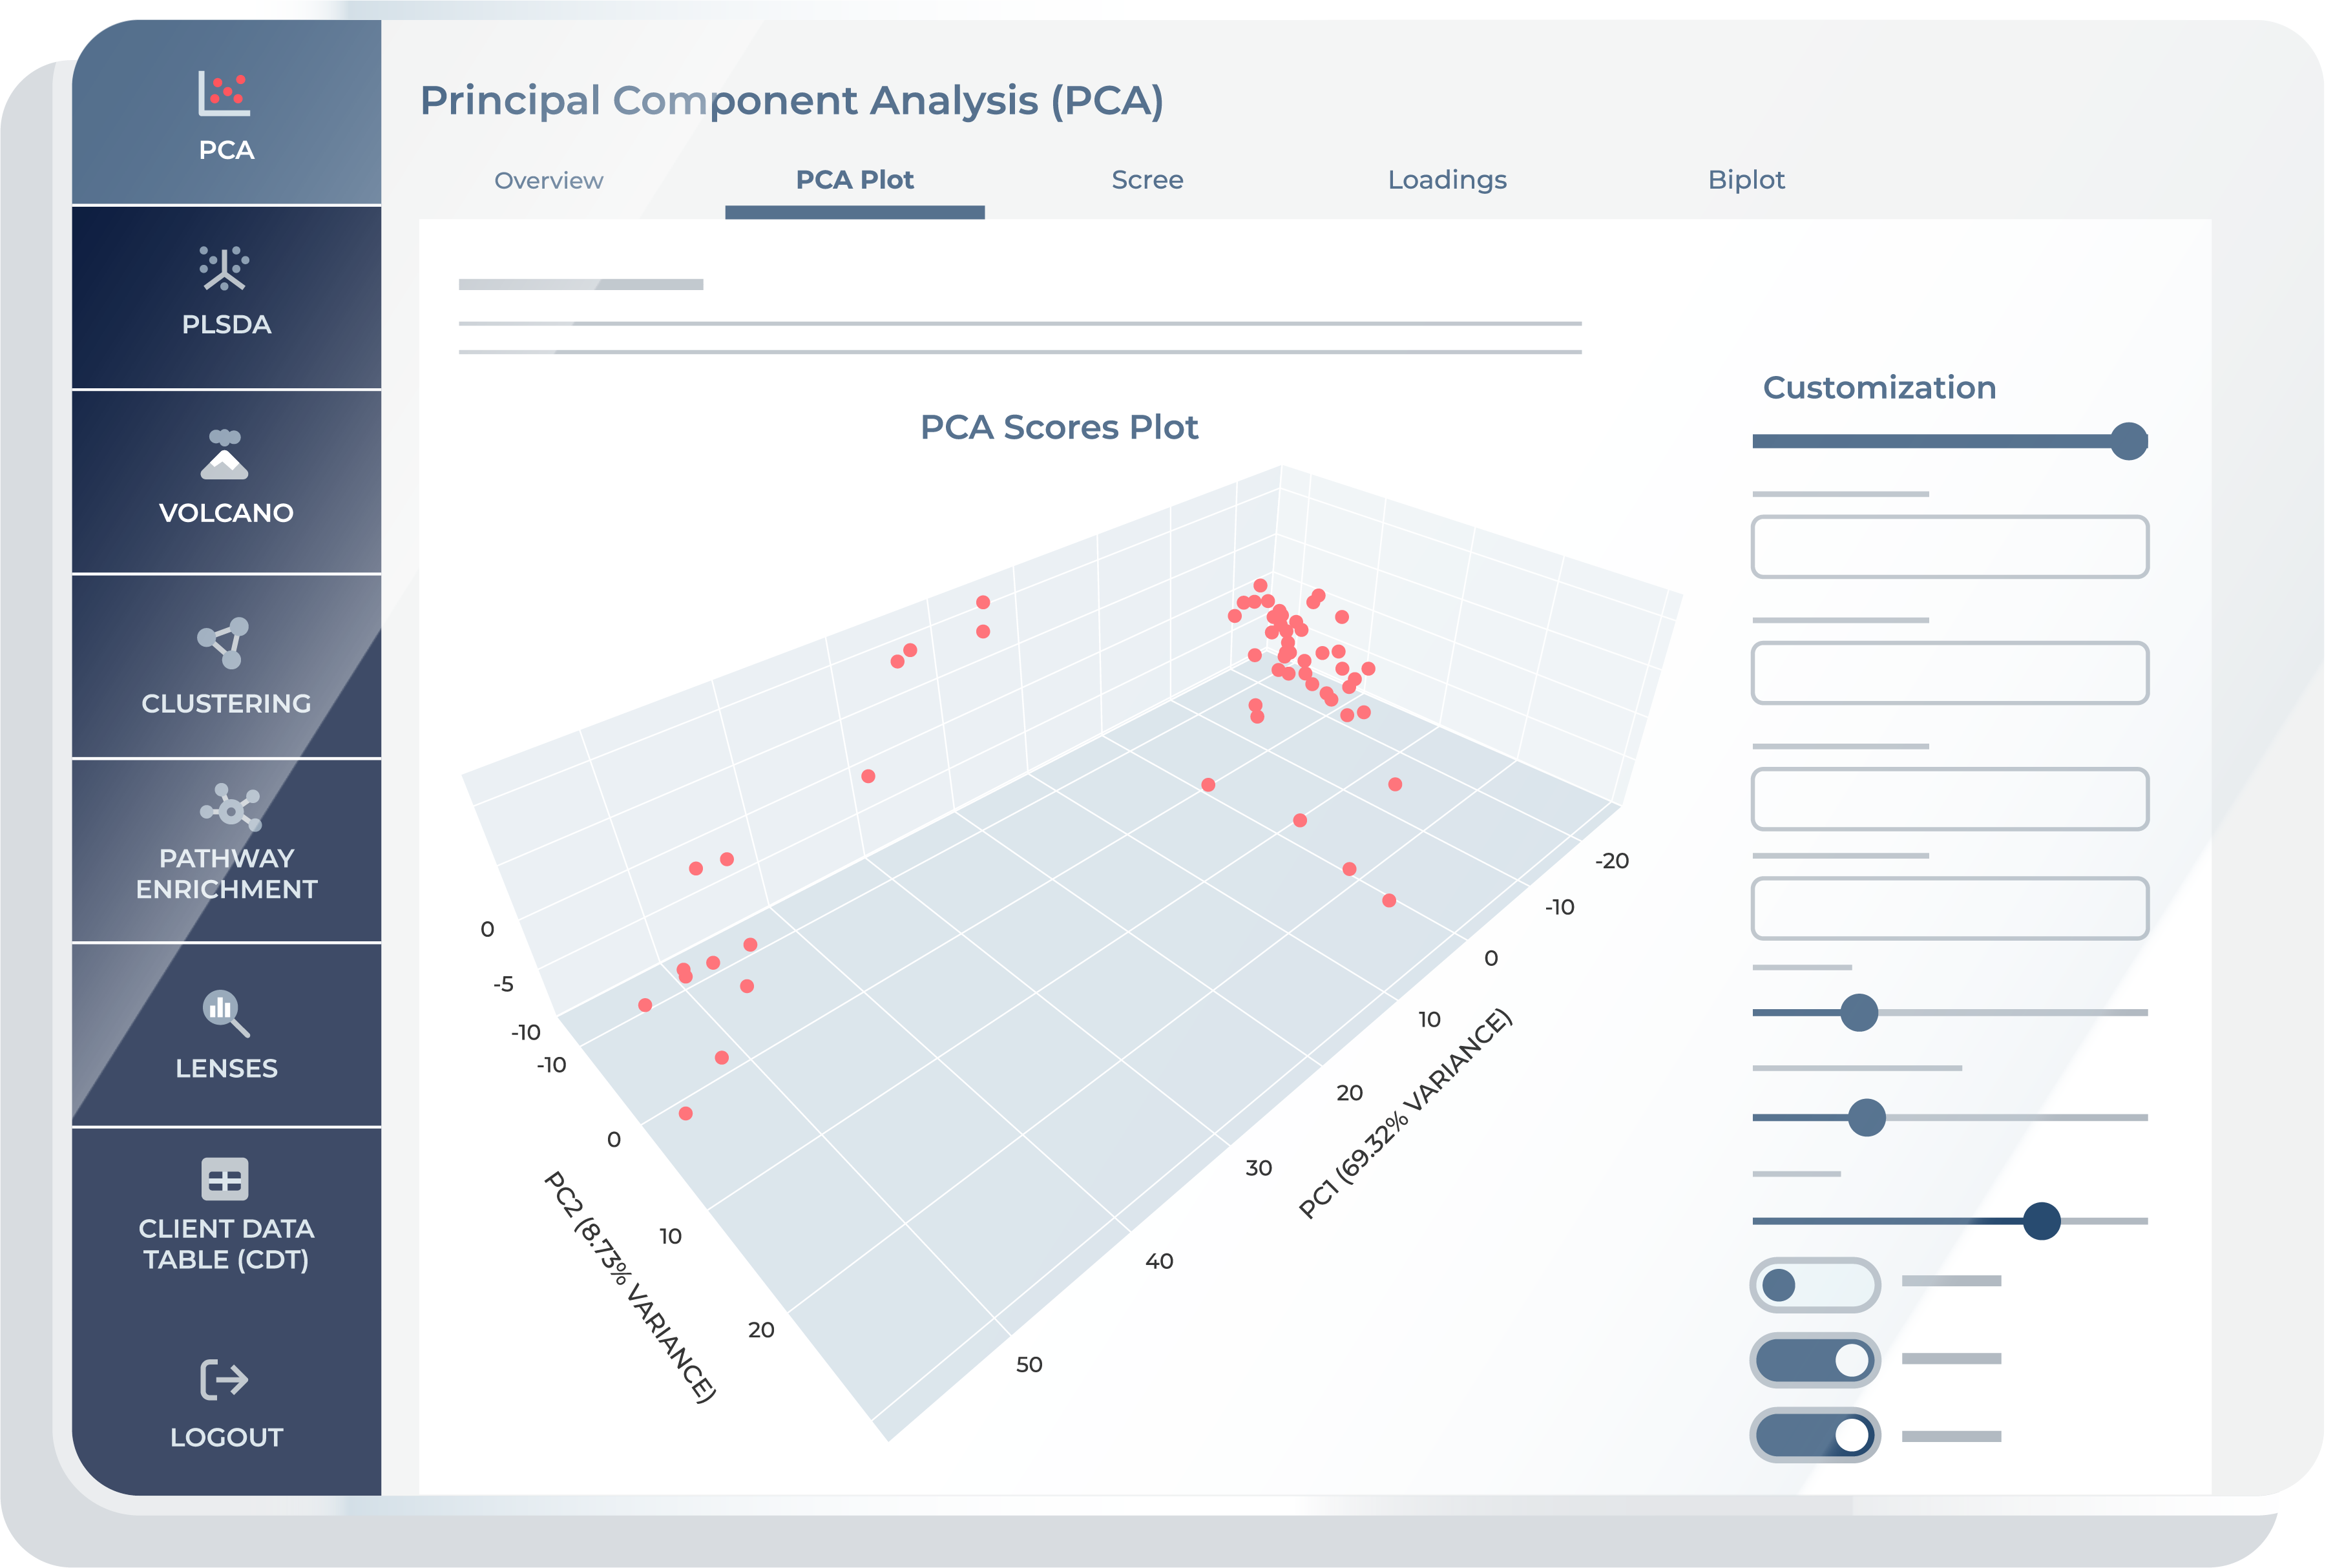
The “PCA Plot” feature shows the projection of samples onto the first few Principal Components, represented as 2D or 3D plots. Scores are derived from projecting the original data onto the PCs and allow a reduced-dimensional view of the dataset.
Scree
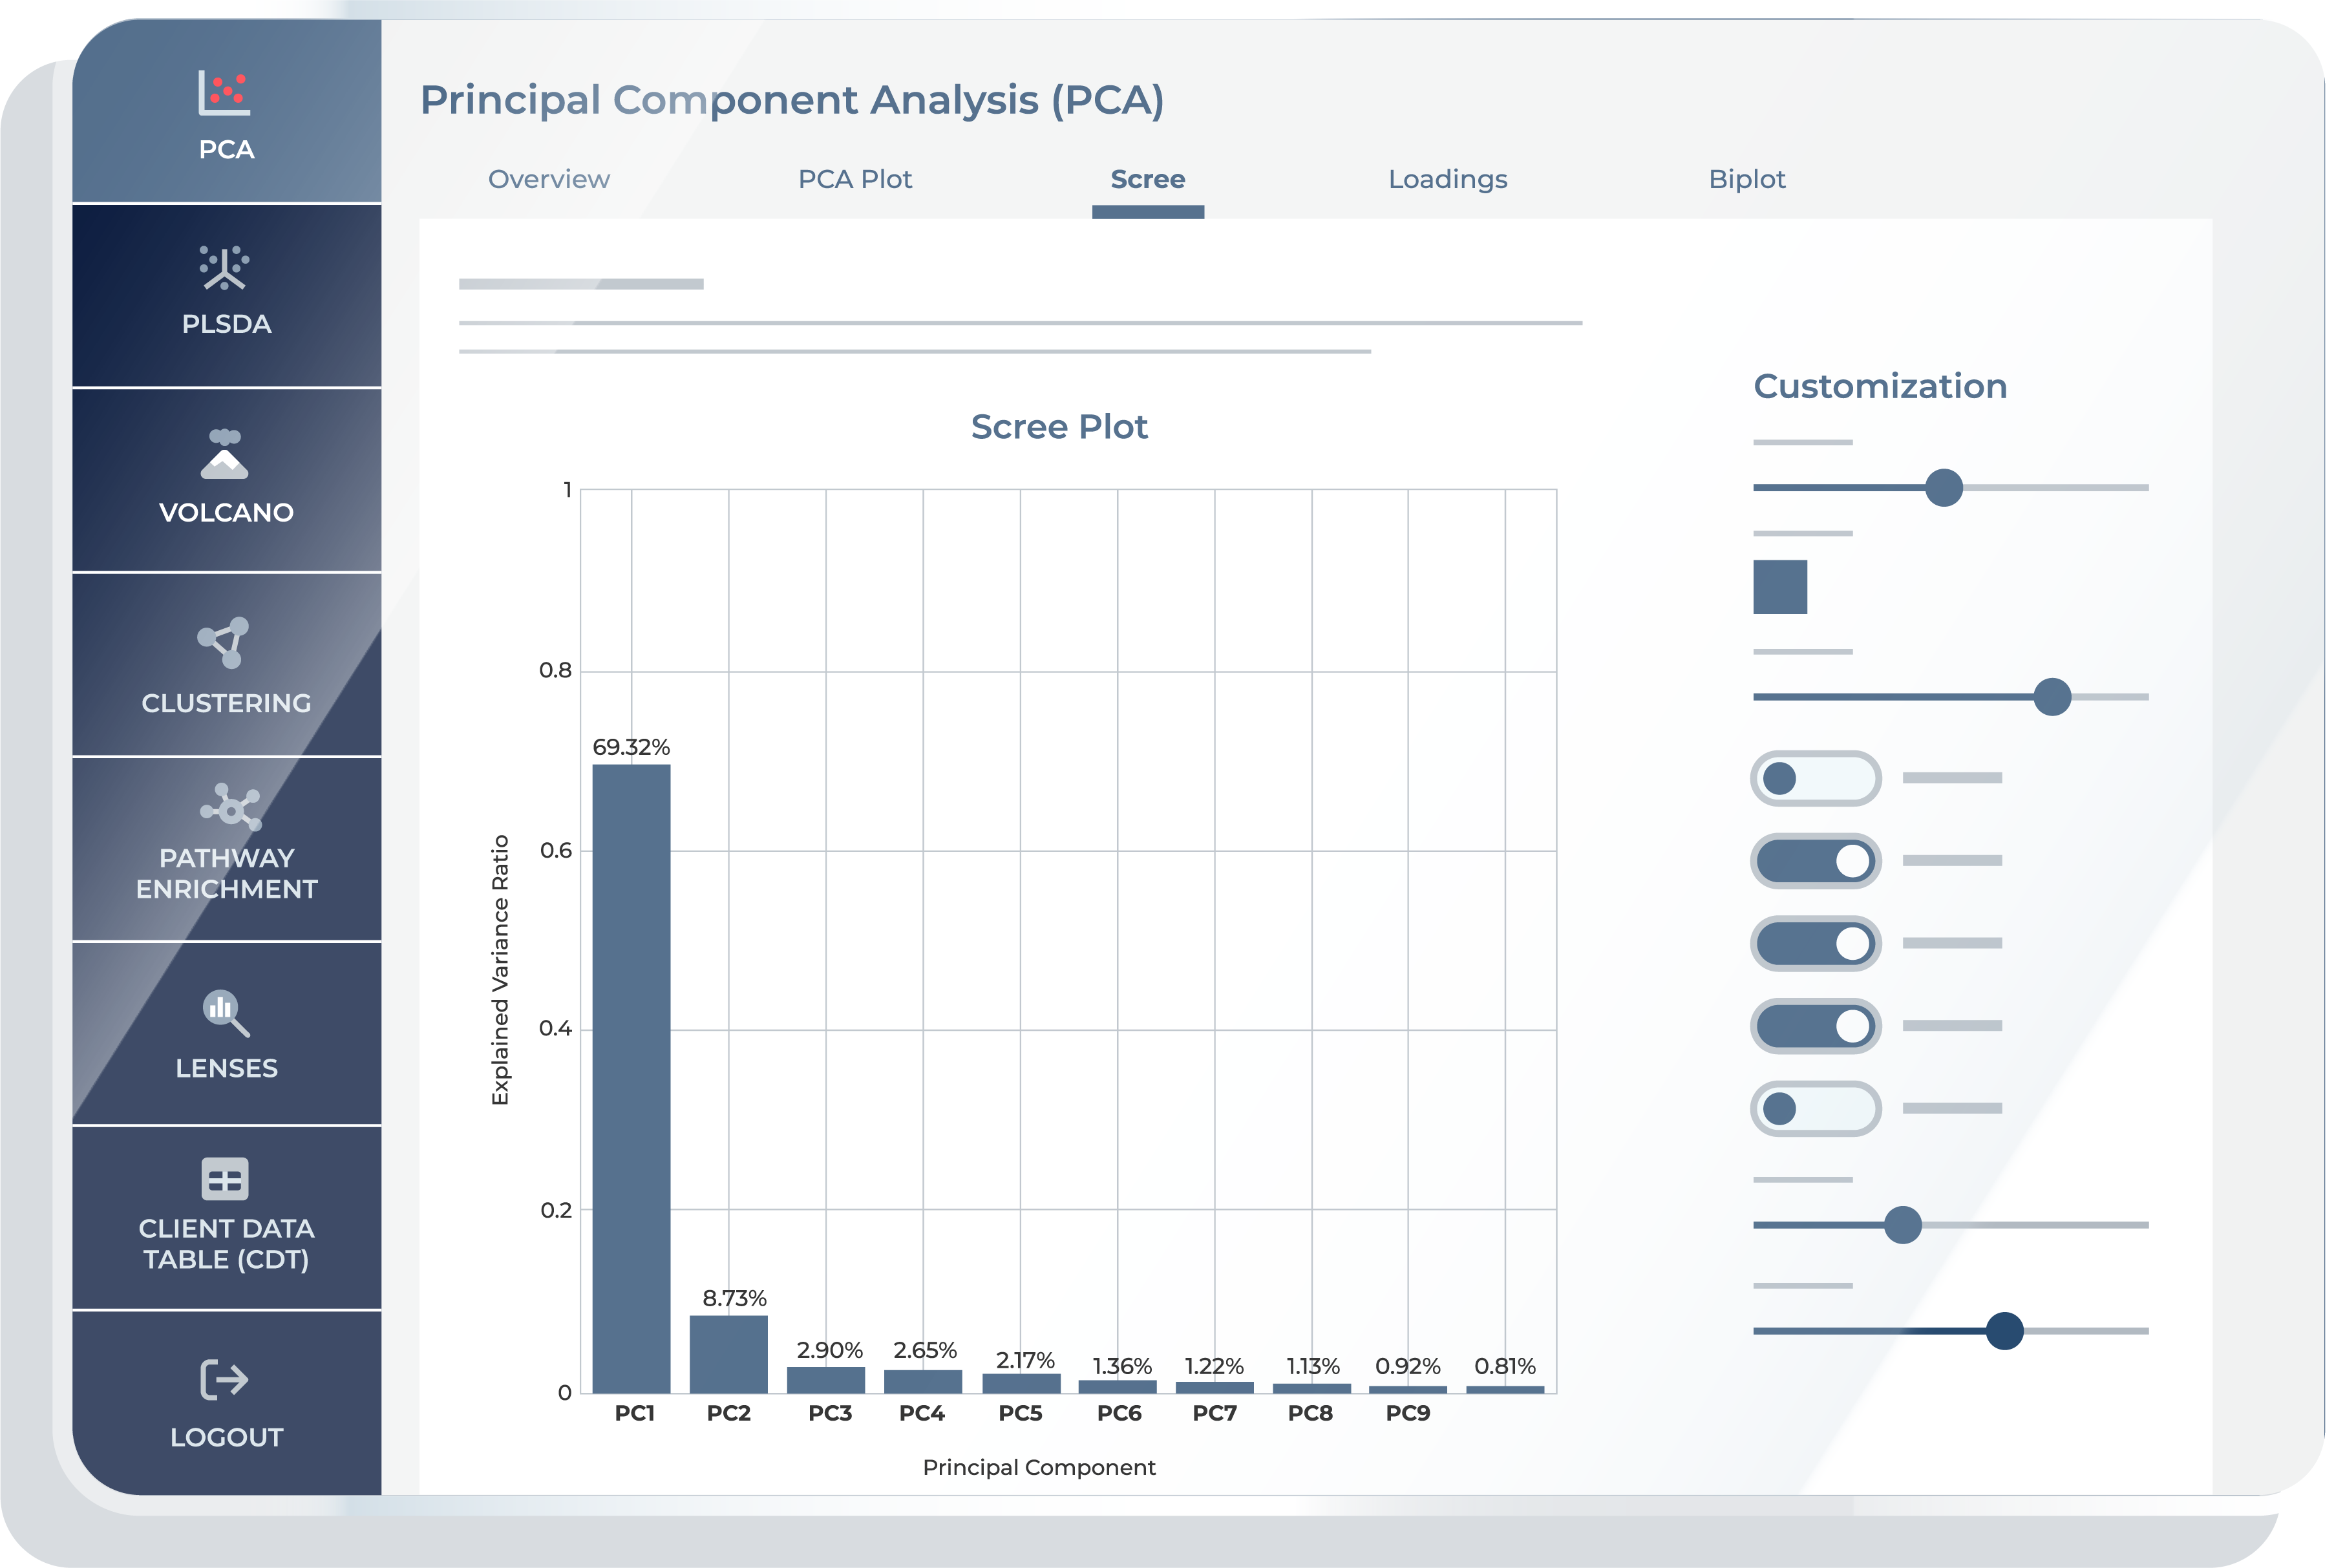
The “Scree” feature provides a bar chart indicating the proportion of variance explained by each Principal Component. This visualization aids in determining the significance of each PC, showing the cumulative amount of variance captured as more components are considered.
Loadings
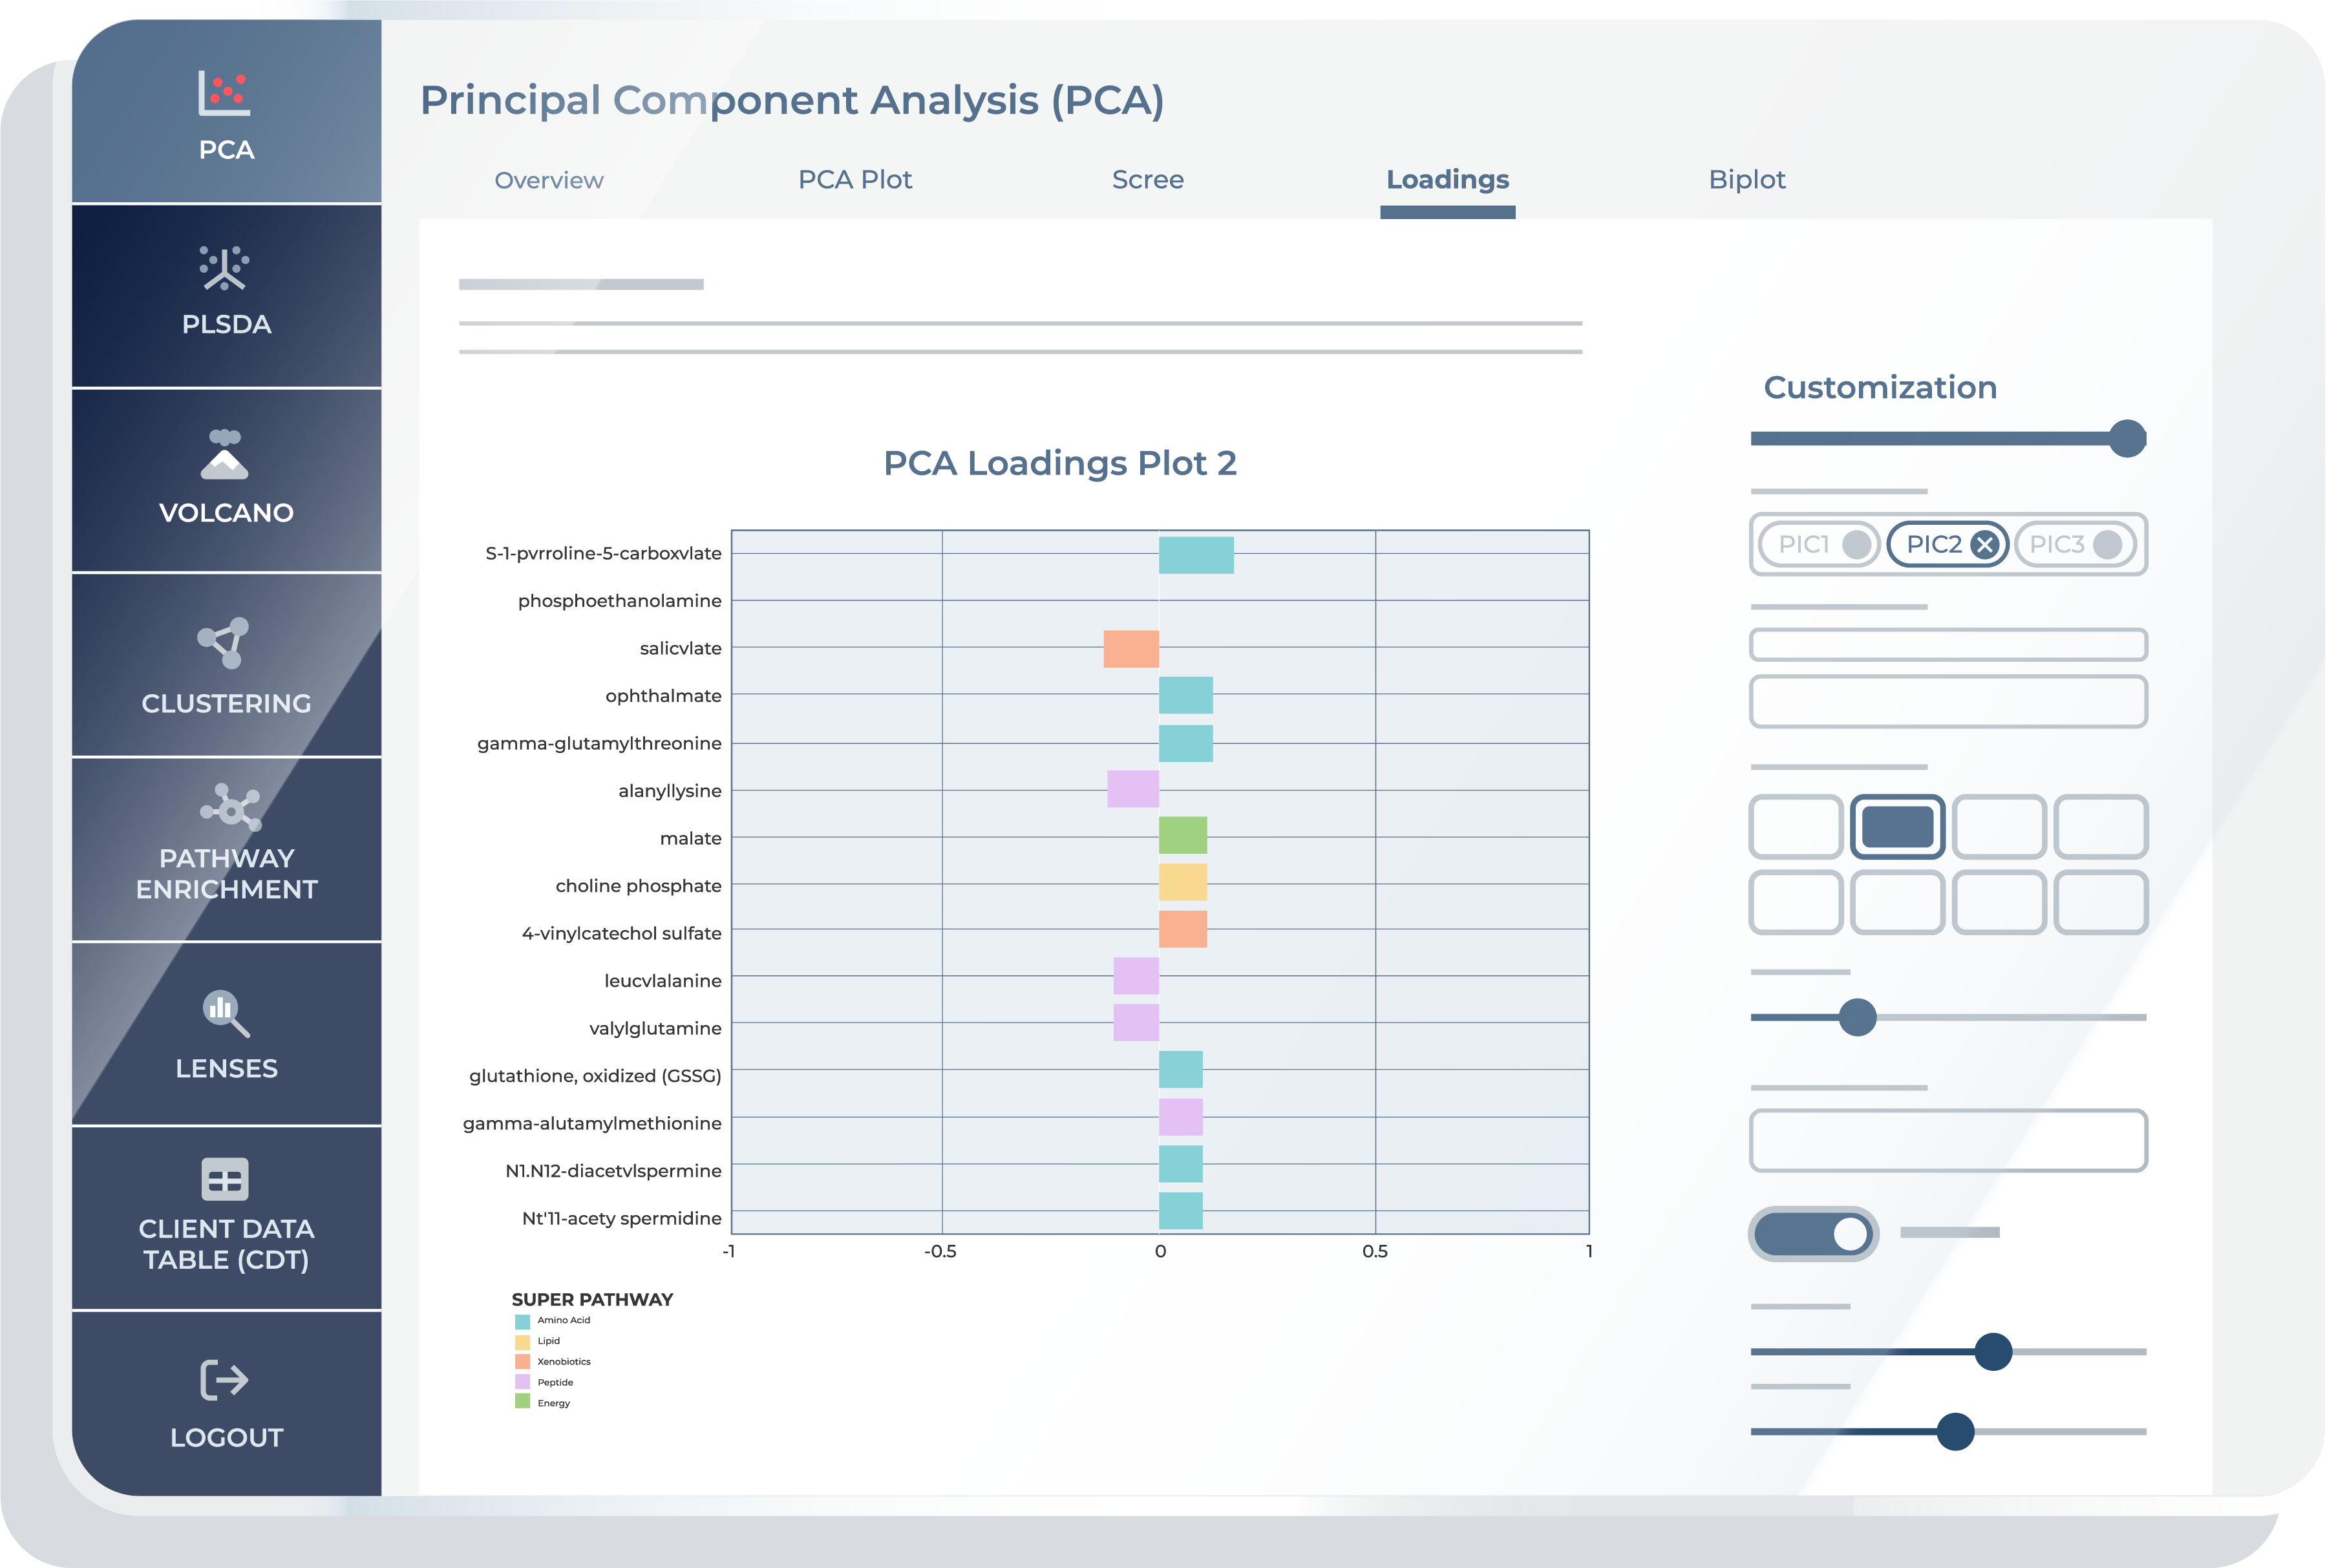
In the “Loadings” feature, you can view how each metabolite contributes to specific Principal Components. Bar plots here display the loadings, which are the weights of each original variable on the PCs. This visualization helps in identifying metabolites with a strong influence on selected PCs.
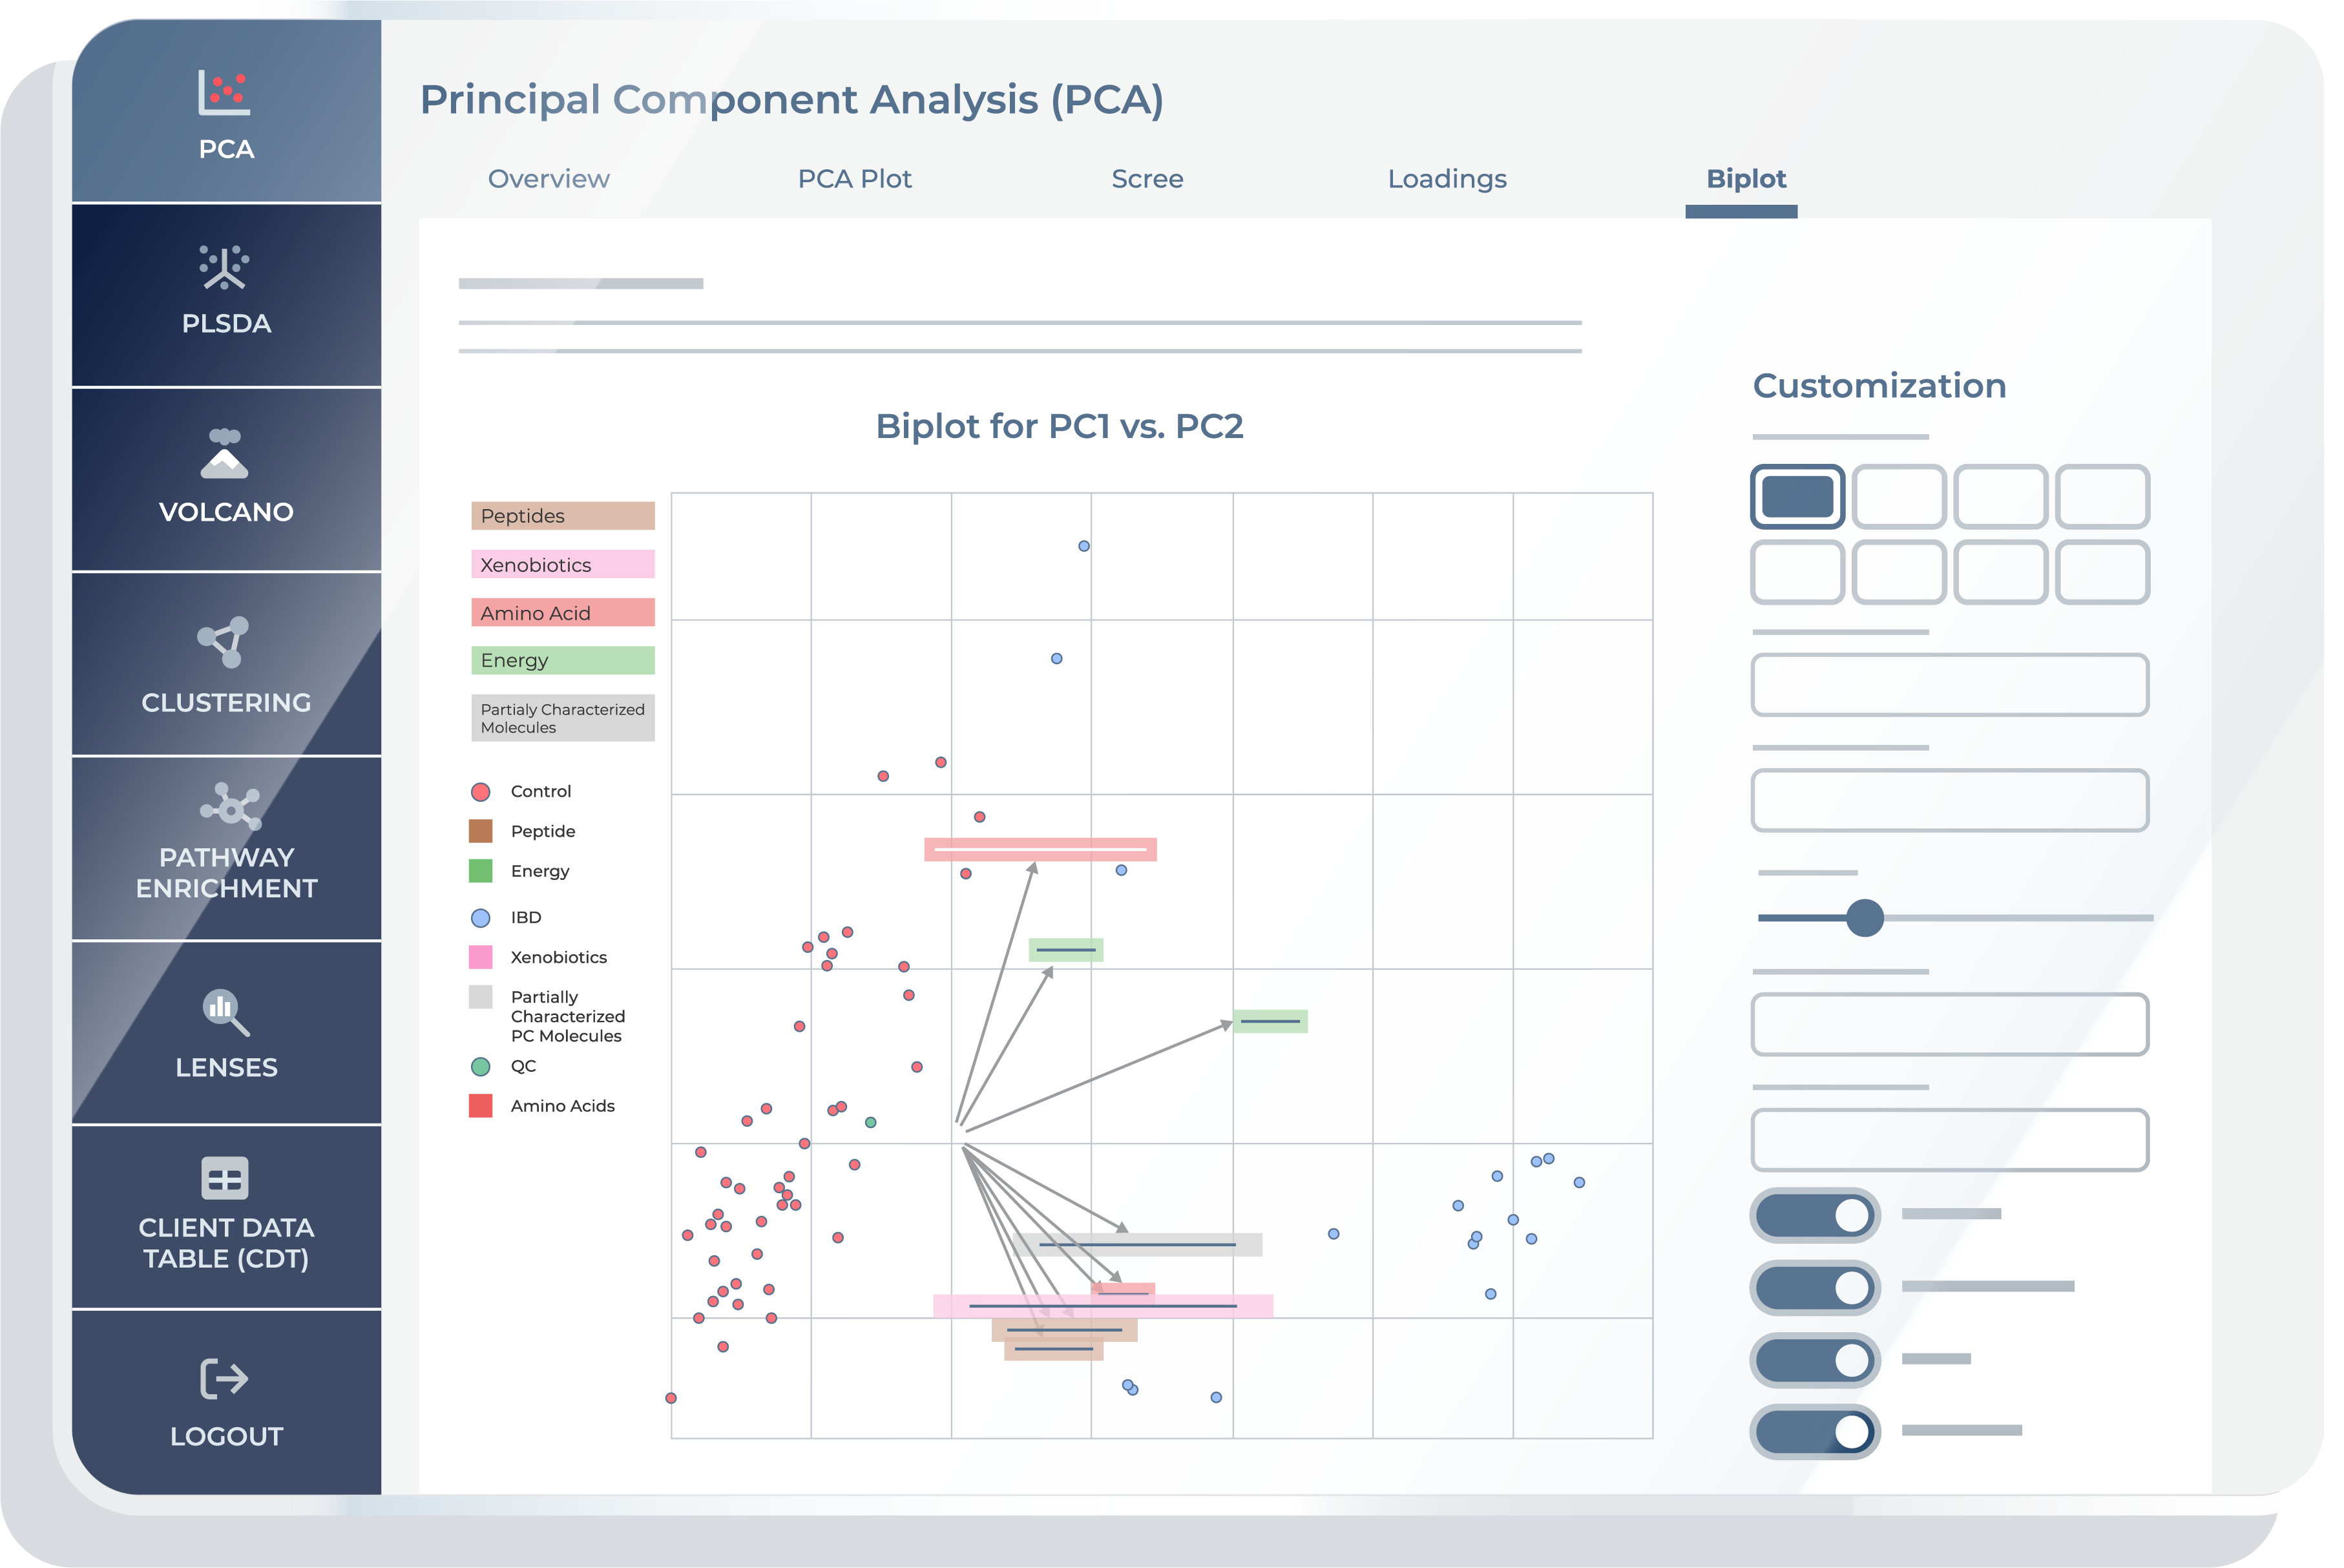
Biplot
The “Biplot” feature combines the scores and loadings into a single plot. It represents the relationship between samples and how metabolites influence these relationships on selected Principal Components. This plot aids in correlating original metabolites to the distribution of samples in the PCA space.
Bioinformatics Platform
Share this page
Demo Our Bioinformatics Platform For Free.
Contact Us
Talk with an expert
Request a quote for our services, get more information on sample types and handling procedures, request a letter of support, or submit a question about how metabolomics can advance your research.
Corporate Headquarters
617 Davis Drive, Suite 100
Morrisville, NC 27560
Mailing Address:
P.O. Box 110407
Research Triangle Park, NC 27709

