Bioinformatics
Partial Least-Squares Discriminant Analysis (PLS-DA)
PLS-DA Overview
PLS-DA plays a pivotal role in metabolomics analysis, providing a powerful statistical framework for unraveling complex relationships within high-dimensional datasets. PLS-DA excels at performing simultaneous dimensionality reduction and classification, allowing researchers to discern patterns associated with different experimental conditions or sample classes. This method is particularly beneficial for identifying biomarkers, distinguishing between physiological states, and predicting class membership for new samples based on their metabolite profiles.
PLS-DA is a supervised dimensionality reduction method that, unlike PCA, incorporates class labels in the analysis. It discovers latent variables (components) that maximize the separation between different predefined groups (e.g., healthy vs diseased) in the data. By projecting the data onto these latent variables, PLS-DA captures the variance and correlation structure in the data most relevant to group differentiation.
The primary advantage of PLS-DA over PCA is its ability to focus on and enhance group separations. While PCA solely maximizes variance without considering class labels, PLS-DA uses these labels to find the direction of maximum class separation, which is more suitable for classification tasks. In metabolomics, this means PLS-DA can more effectively highlight metabolites that differentiate between conditions such as disease states.
Demo the Bioinformatics Platform
Explore, interpret, and elucidate the biological impact of your samples using publication-ready tools.
PLS-DA within Our Bioinformatics Platform
Given its supervised nature, PLS-DA requires careful parameterization and an understanding of the underlying data. Metabolon’s expertise in applying statistical methods ensures that the input data for PLS-DA is appropriately prepared, allowing for robust and meaningful analysis. In the context of Metabolon’s Bioinformatics Platform, PLS-DA can help you achieve the following:
Exploratory Data Analysis
PLS-DA assists in identifying patterns related to different conditions and can be instrumental in hypothesis generation.
Visualization and Pattern Recognition
PLS-DA’s ability to reduce data dimensions while preserving class-discriminative information makes it a powerful tool for visualizing complex datasets. It helps distinguish between groups, like differentiating healthy and diseased states based on metabolomic profiles.
Feature Selection
PLS-DA is effective in filtering out noise and focusing on metabolites that are most relevant for distinguishing between groups, offering a clearer view of the most impactful data features.
Simplify Complex Analysis and Enhance Hypothesis Generation
Automated PLS-DA Computation
Our platform simplifies the PLS-DA process by precomputing analyses, removing the need for you to set intricate parameters. The platform computes various discriminant components, ready for immediate exploration and comparison. The data provided as input to the application is normalized and prepared ensuring accuracy and consistency in the analysis. You are also provided with the option to validate PLS-DA performance to avoid overfitting in cross-validation and permutation.
Customizable Visualizations
You can fully customize the visual aspects of your PLS-DA plots, from color themes to legend font sizes, allowing for personalized data representation. The tool offers interactive plots that enable you to zoom, pan, and select specific data points or groups, facilitating an in-depth examination of the data. Features such as group-specific coloring and symbolization in plots provide a tailored visual approach, aiding in the development of focused hypotheses.
Exportable Tables
You may export and download all data tables including the dataset and the calculated principal components.
Partial Least-Squares Discriminant Analysis (PLS-DA) Features
Overview Feature
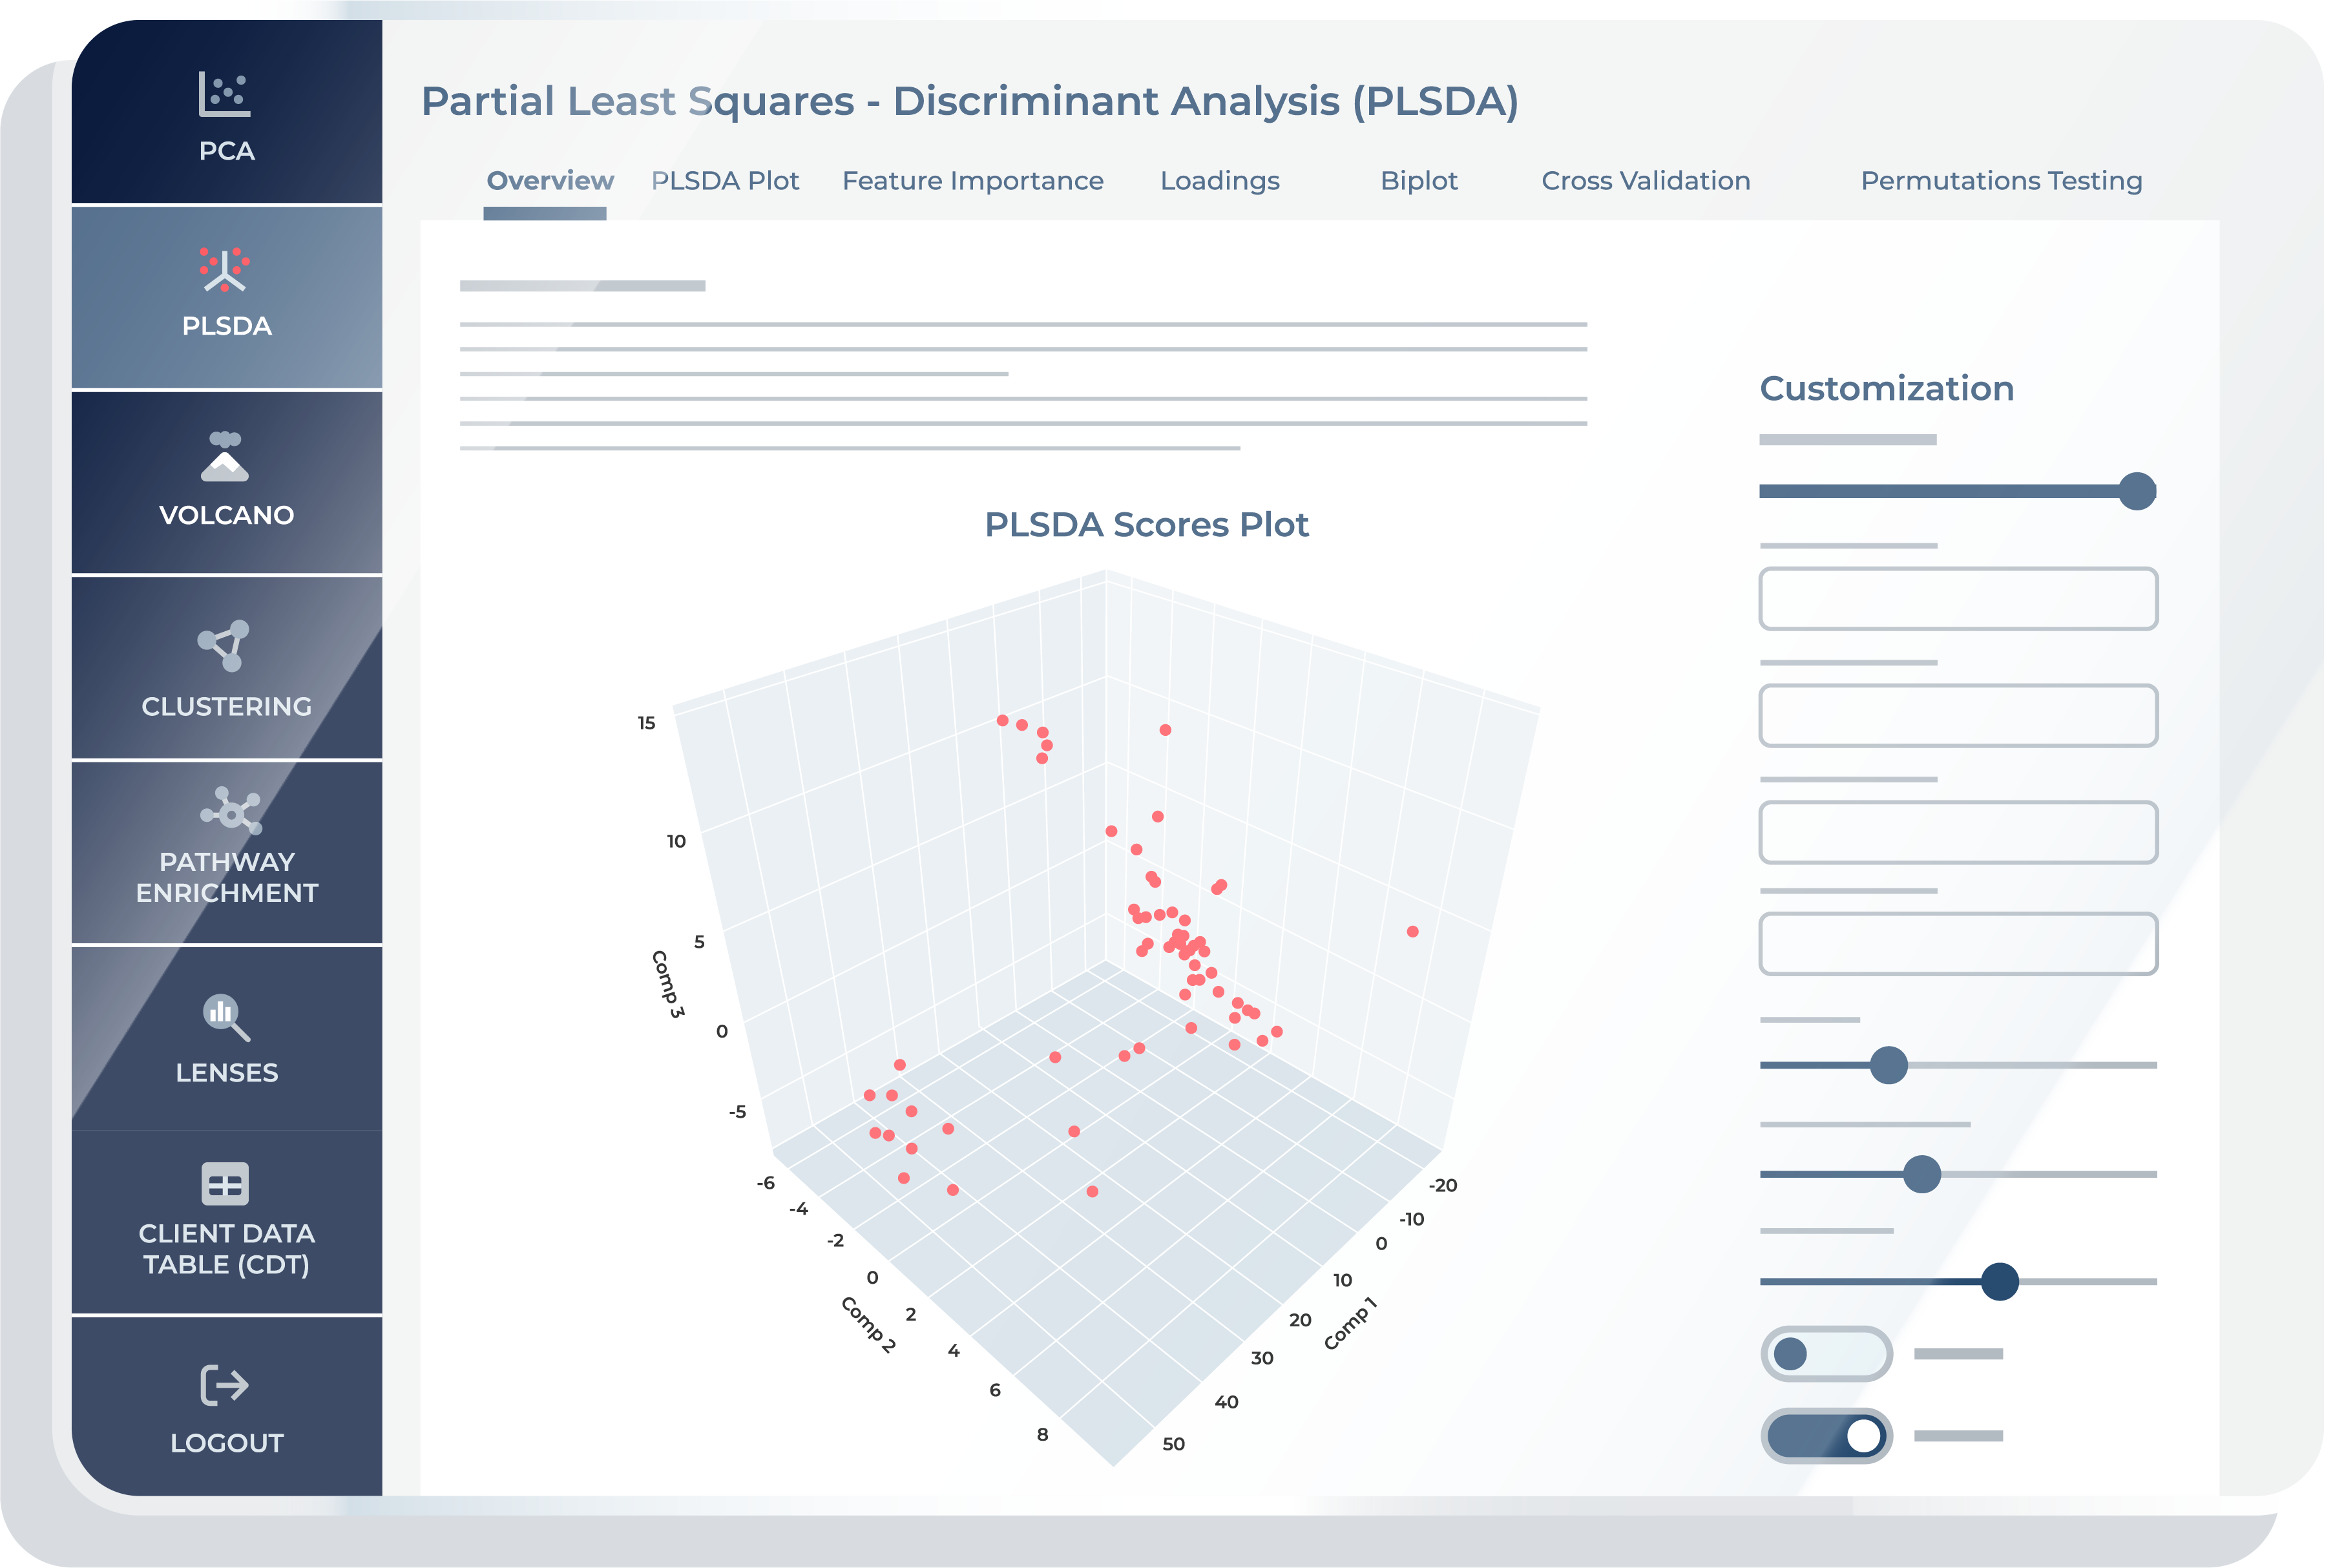
The “Overview” feature is designed to provide you with a bird’s-eye view of component interactions and guide you in deciding which specific component comparisons warrant closer inspection. It serves as an initial exploration tool, helping you identify key areas of interest, potential outliers, or potential groupings before diving into more detailed analyses. This initial assessment assists you in formulating hypotheses and determining the focus of your subsequent investigations in the PLS-DA. Following this broad analysis, you can delve into the subsequent features, which provide more detailed visualizations and insights. These additional features are instrumental for in-depth hypothesis development and for exploring specific aspects of the PLS analysis in greater detail, thereby enhancing the overall analytical process.
PLS-DA Plot
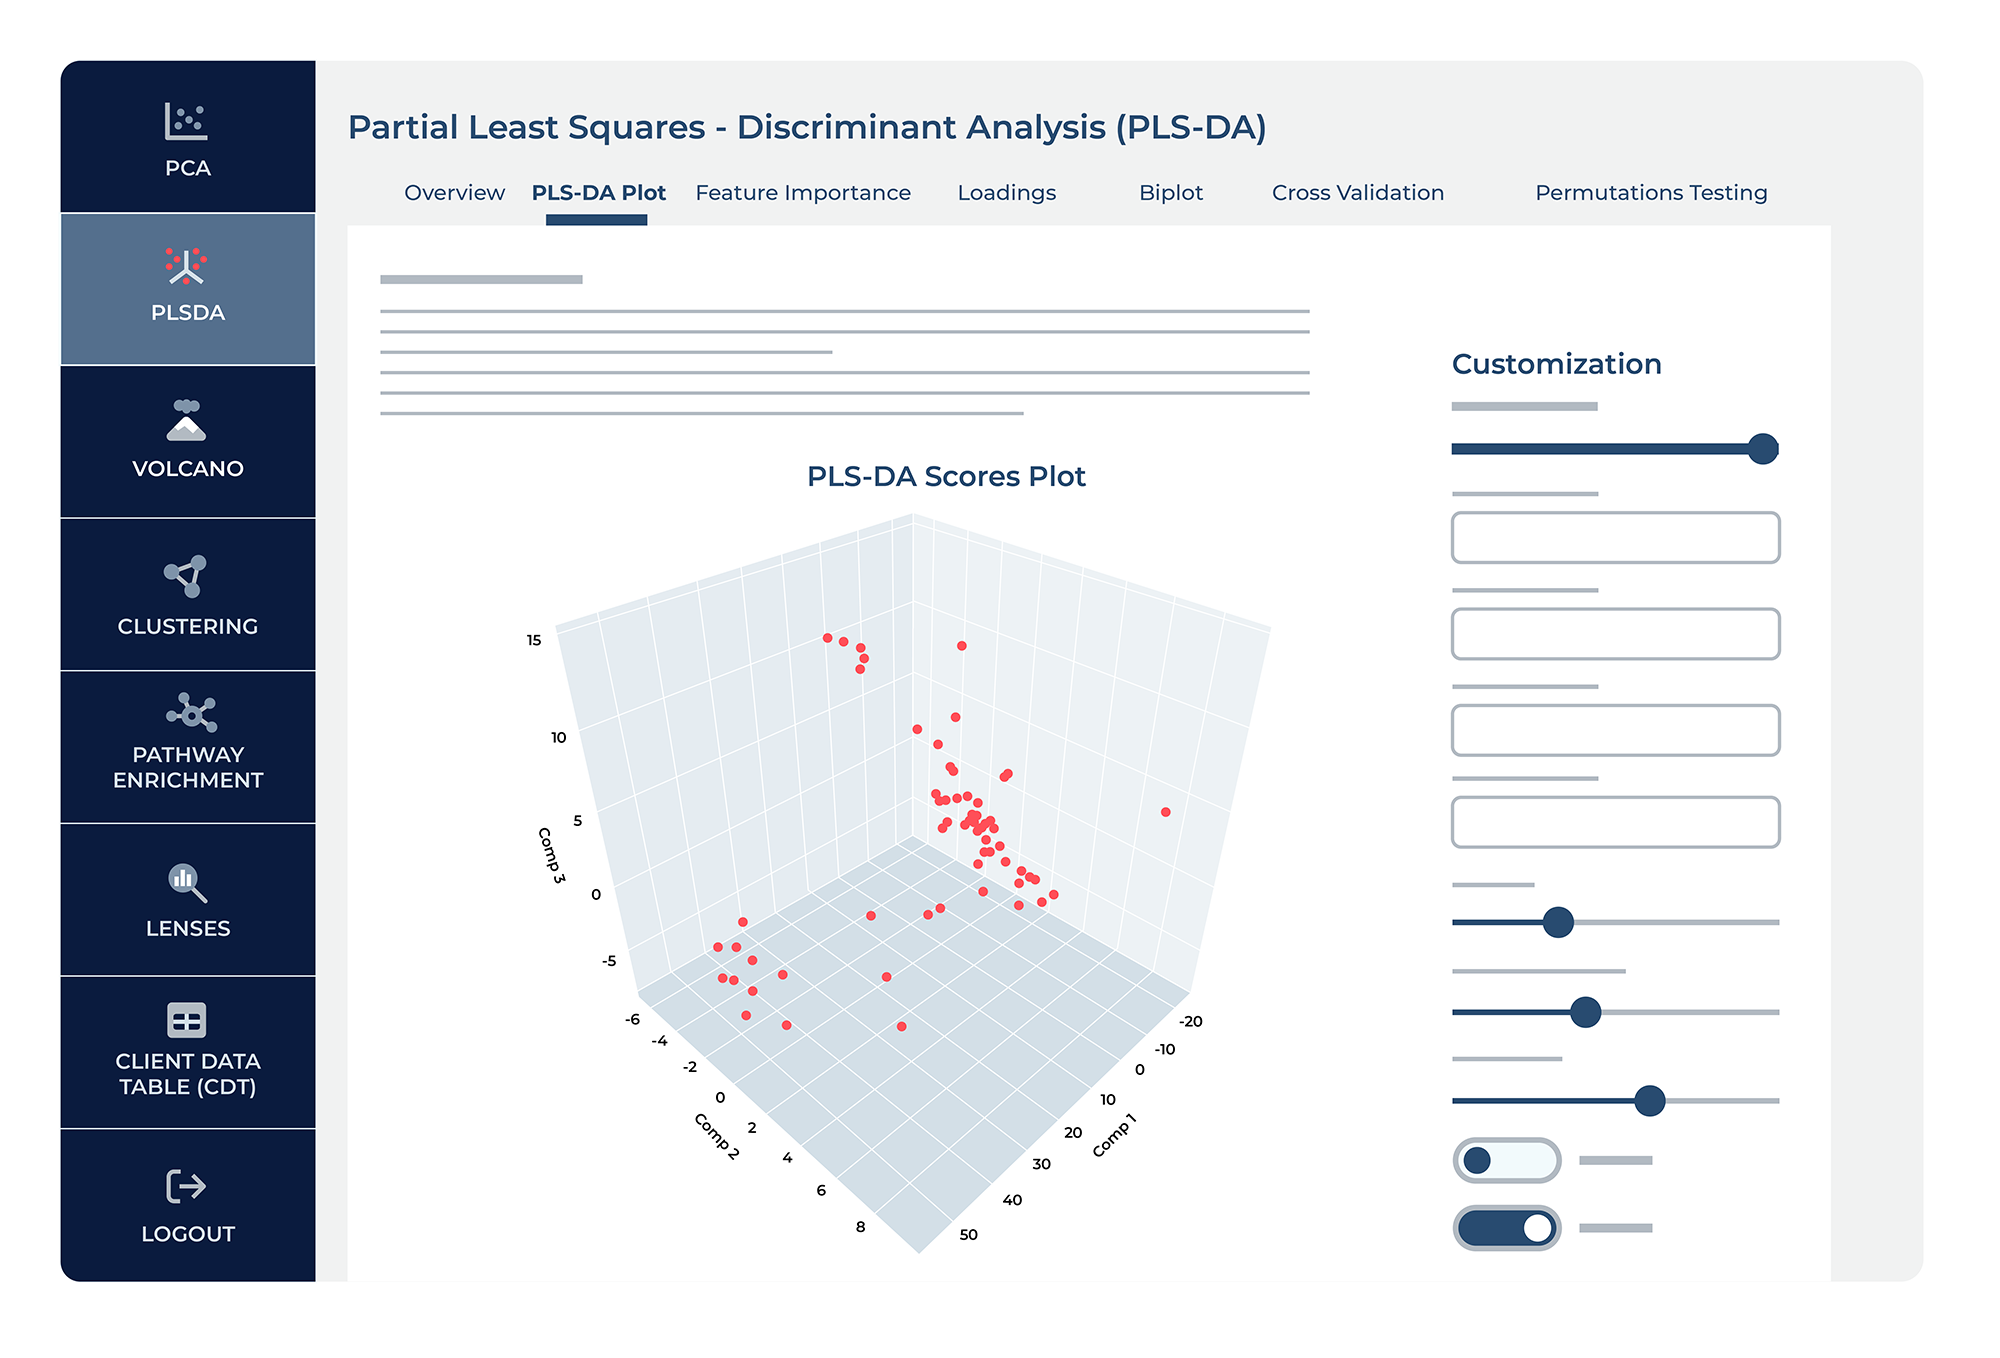
The PLS-DA plot feature allows you to go into more detail on PLS comparisons. This feature allows you to select any two components for a 2D plot or three components for a 3D plot, providing a customizable view of your PLS-DA results. One of the key benefits of this feature is the ability to assign color to data points based on specific groups or conditions, which aids in visually assessing how well the model discriminates between these groups. Additionally, you can choose to shape data points by another variable, further enhancing the interpretability of the plot.
Feature Importance
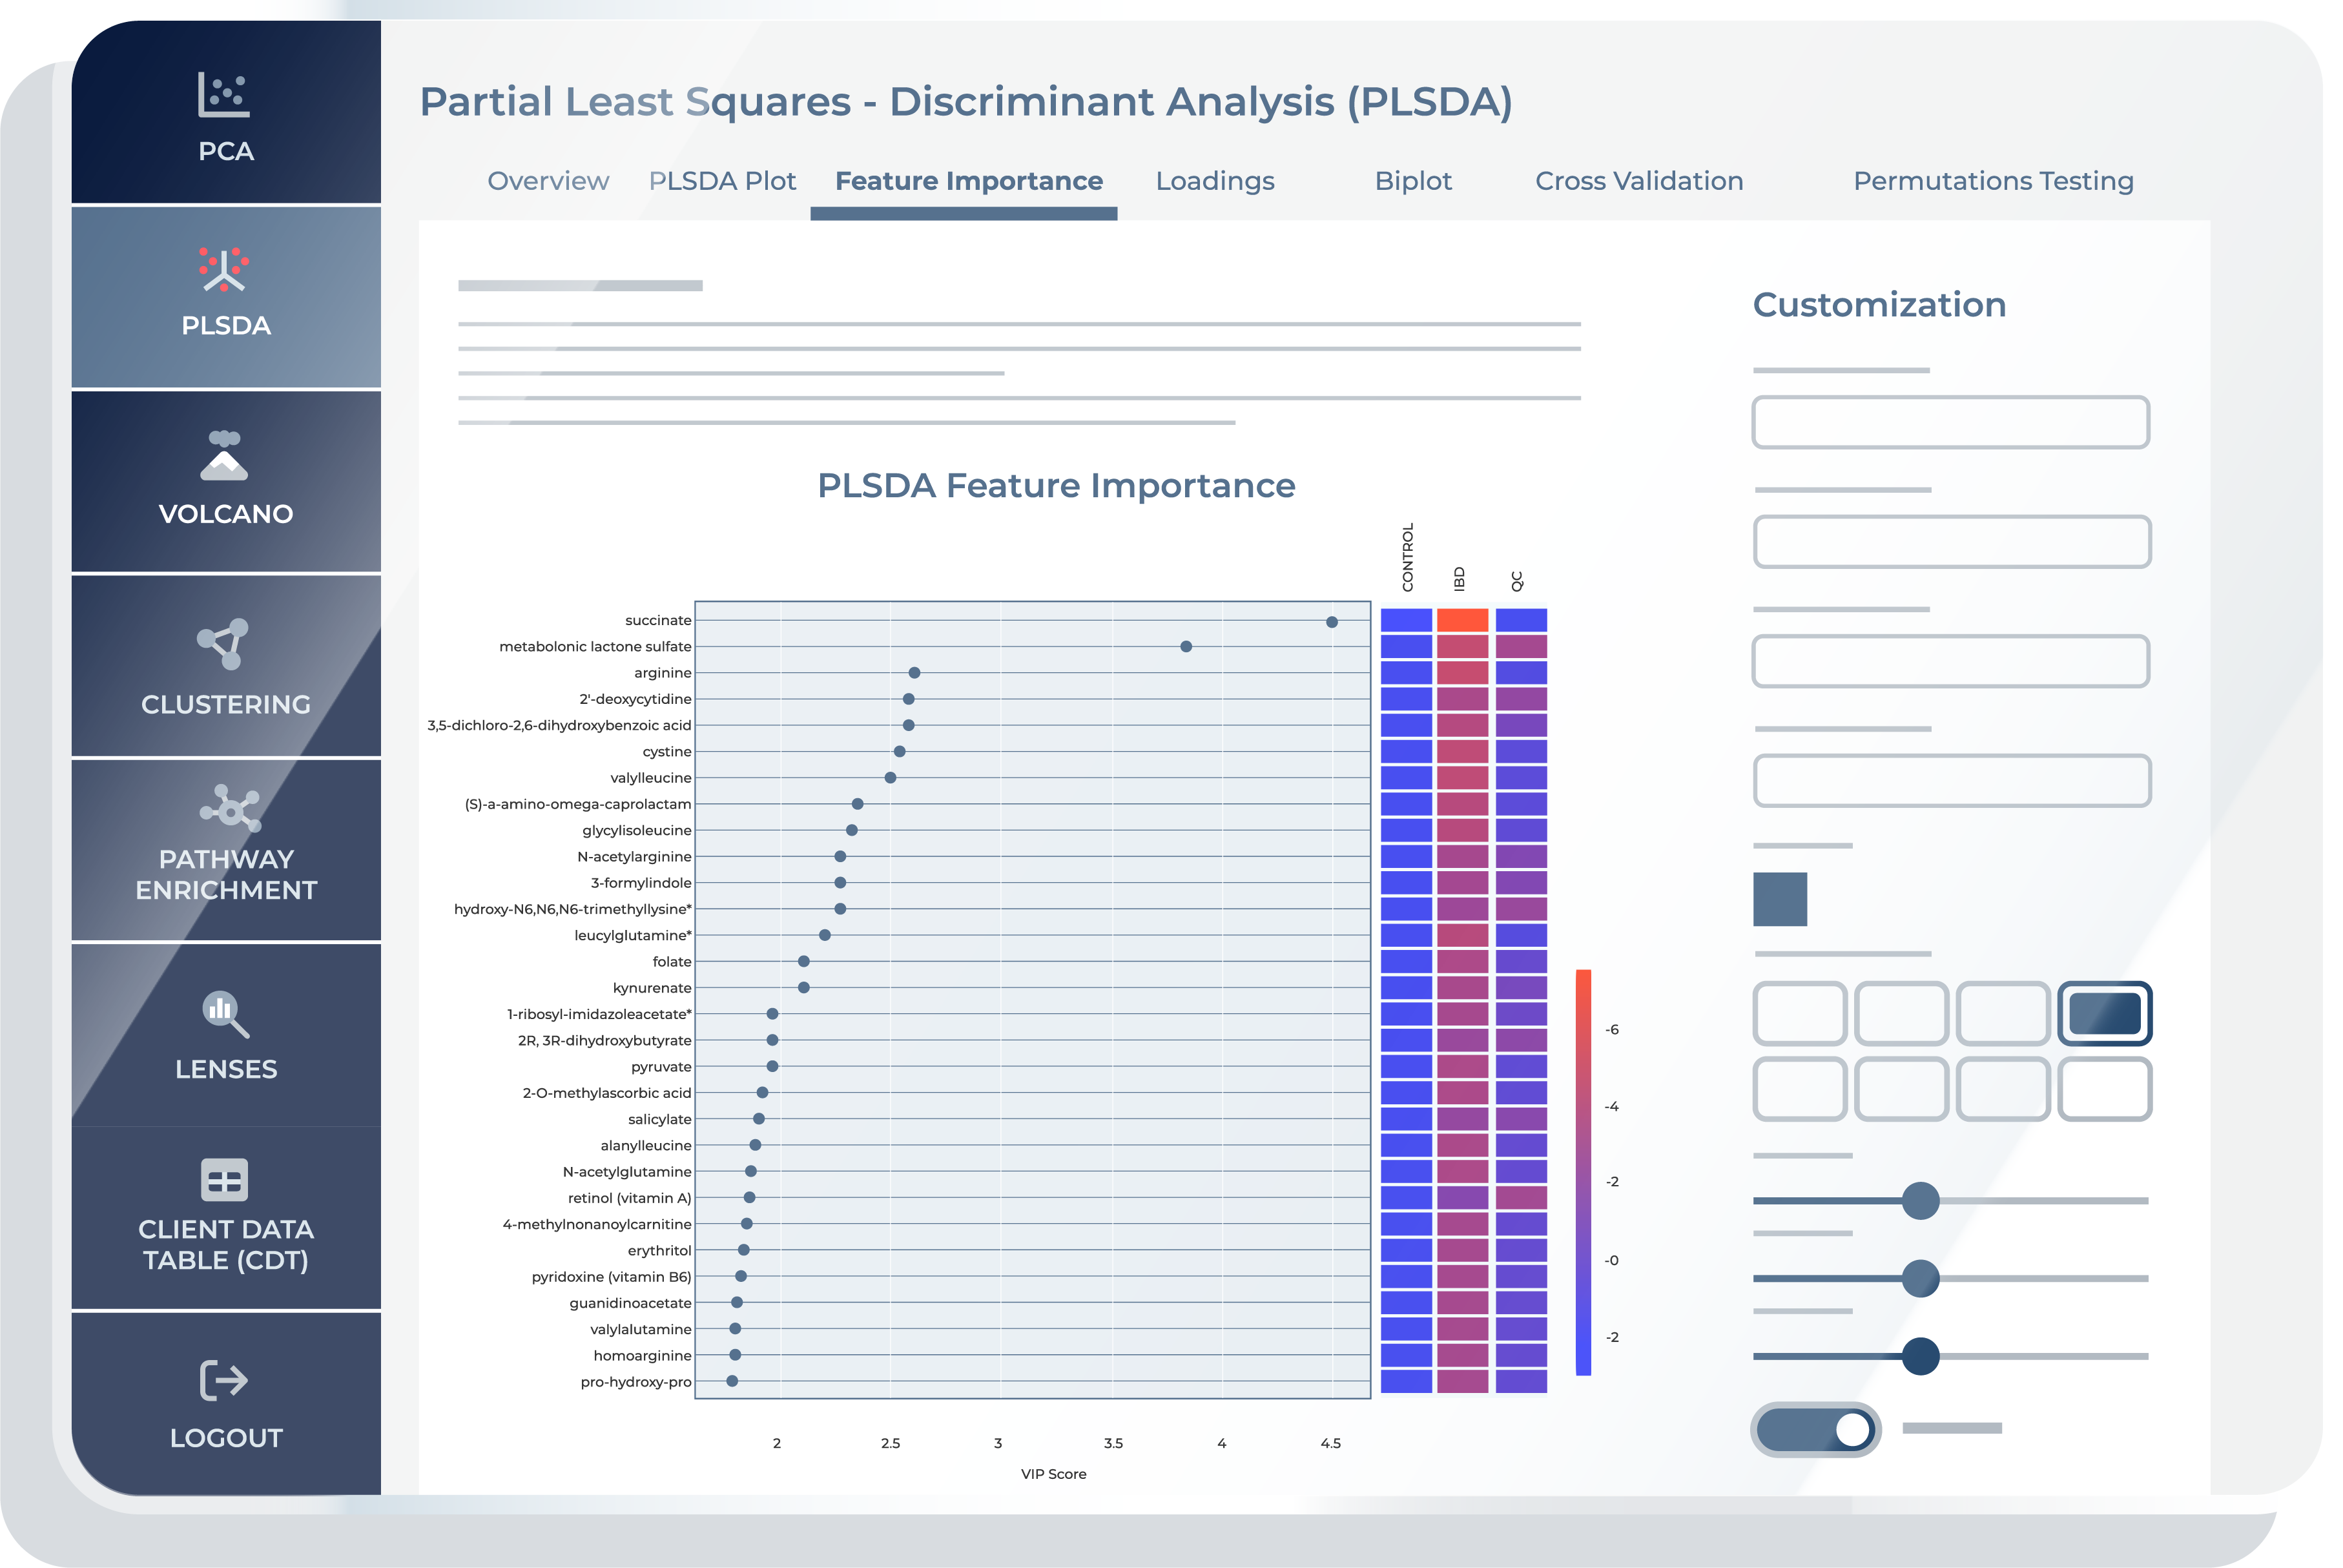
“Feature Importance” is a crucial step if you are seeking to identify the key metabolites that drive the discrimination between different groups or conditions in your metabolomics data. This feature presents VIP (Variable Importance in Projection) scores, ranking the metabolites based on their significance in the PLS-DA model’s ability to classify or discriminate between the chosen groups. You can customize the number of top metabolites displayed, providing a focused view of the most influential variables. In addition to VIP scores, “Feature Importance” includes a heatmap visualization for each group or condition selected, displaying the abundance profiles of the selected top metabolites. These heatmaps offer you an intuitive means of understanding how the identified metabolites vary across different groups, facilitating the identification of trends, patterns, and potential biomarkers associated with specific conditions.
Loadings
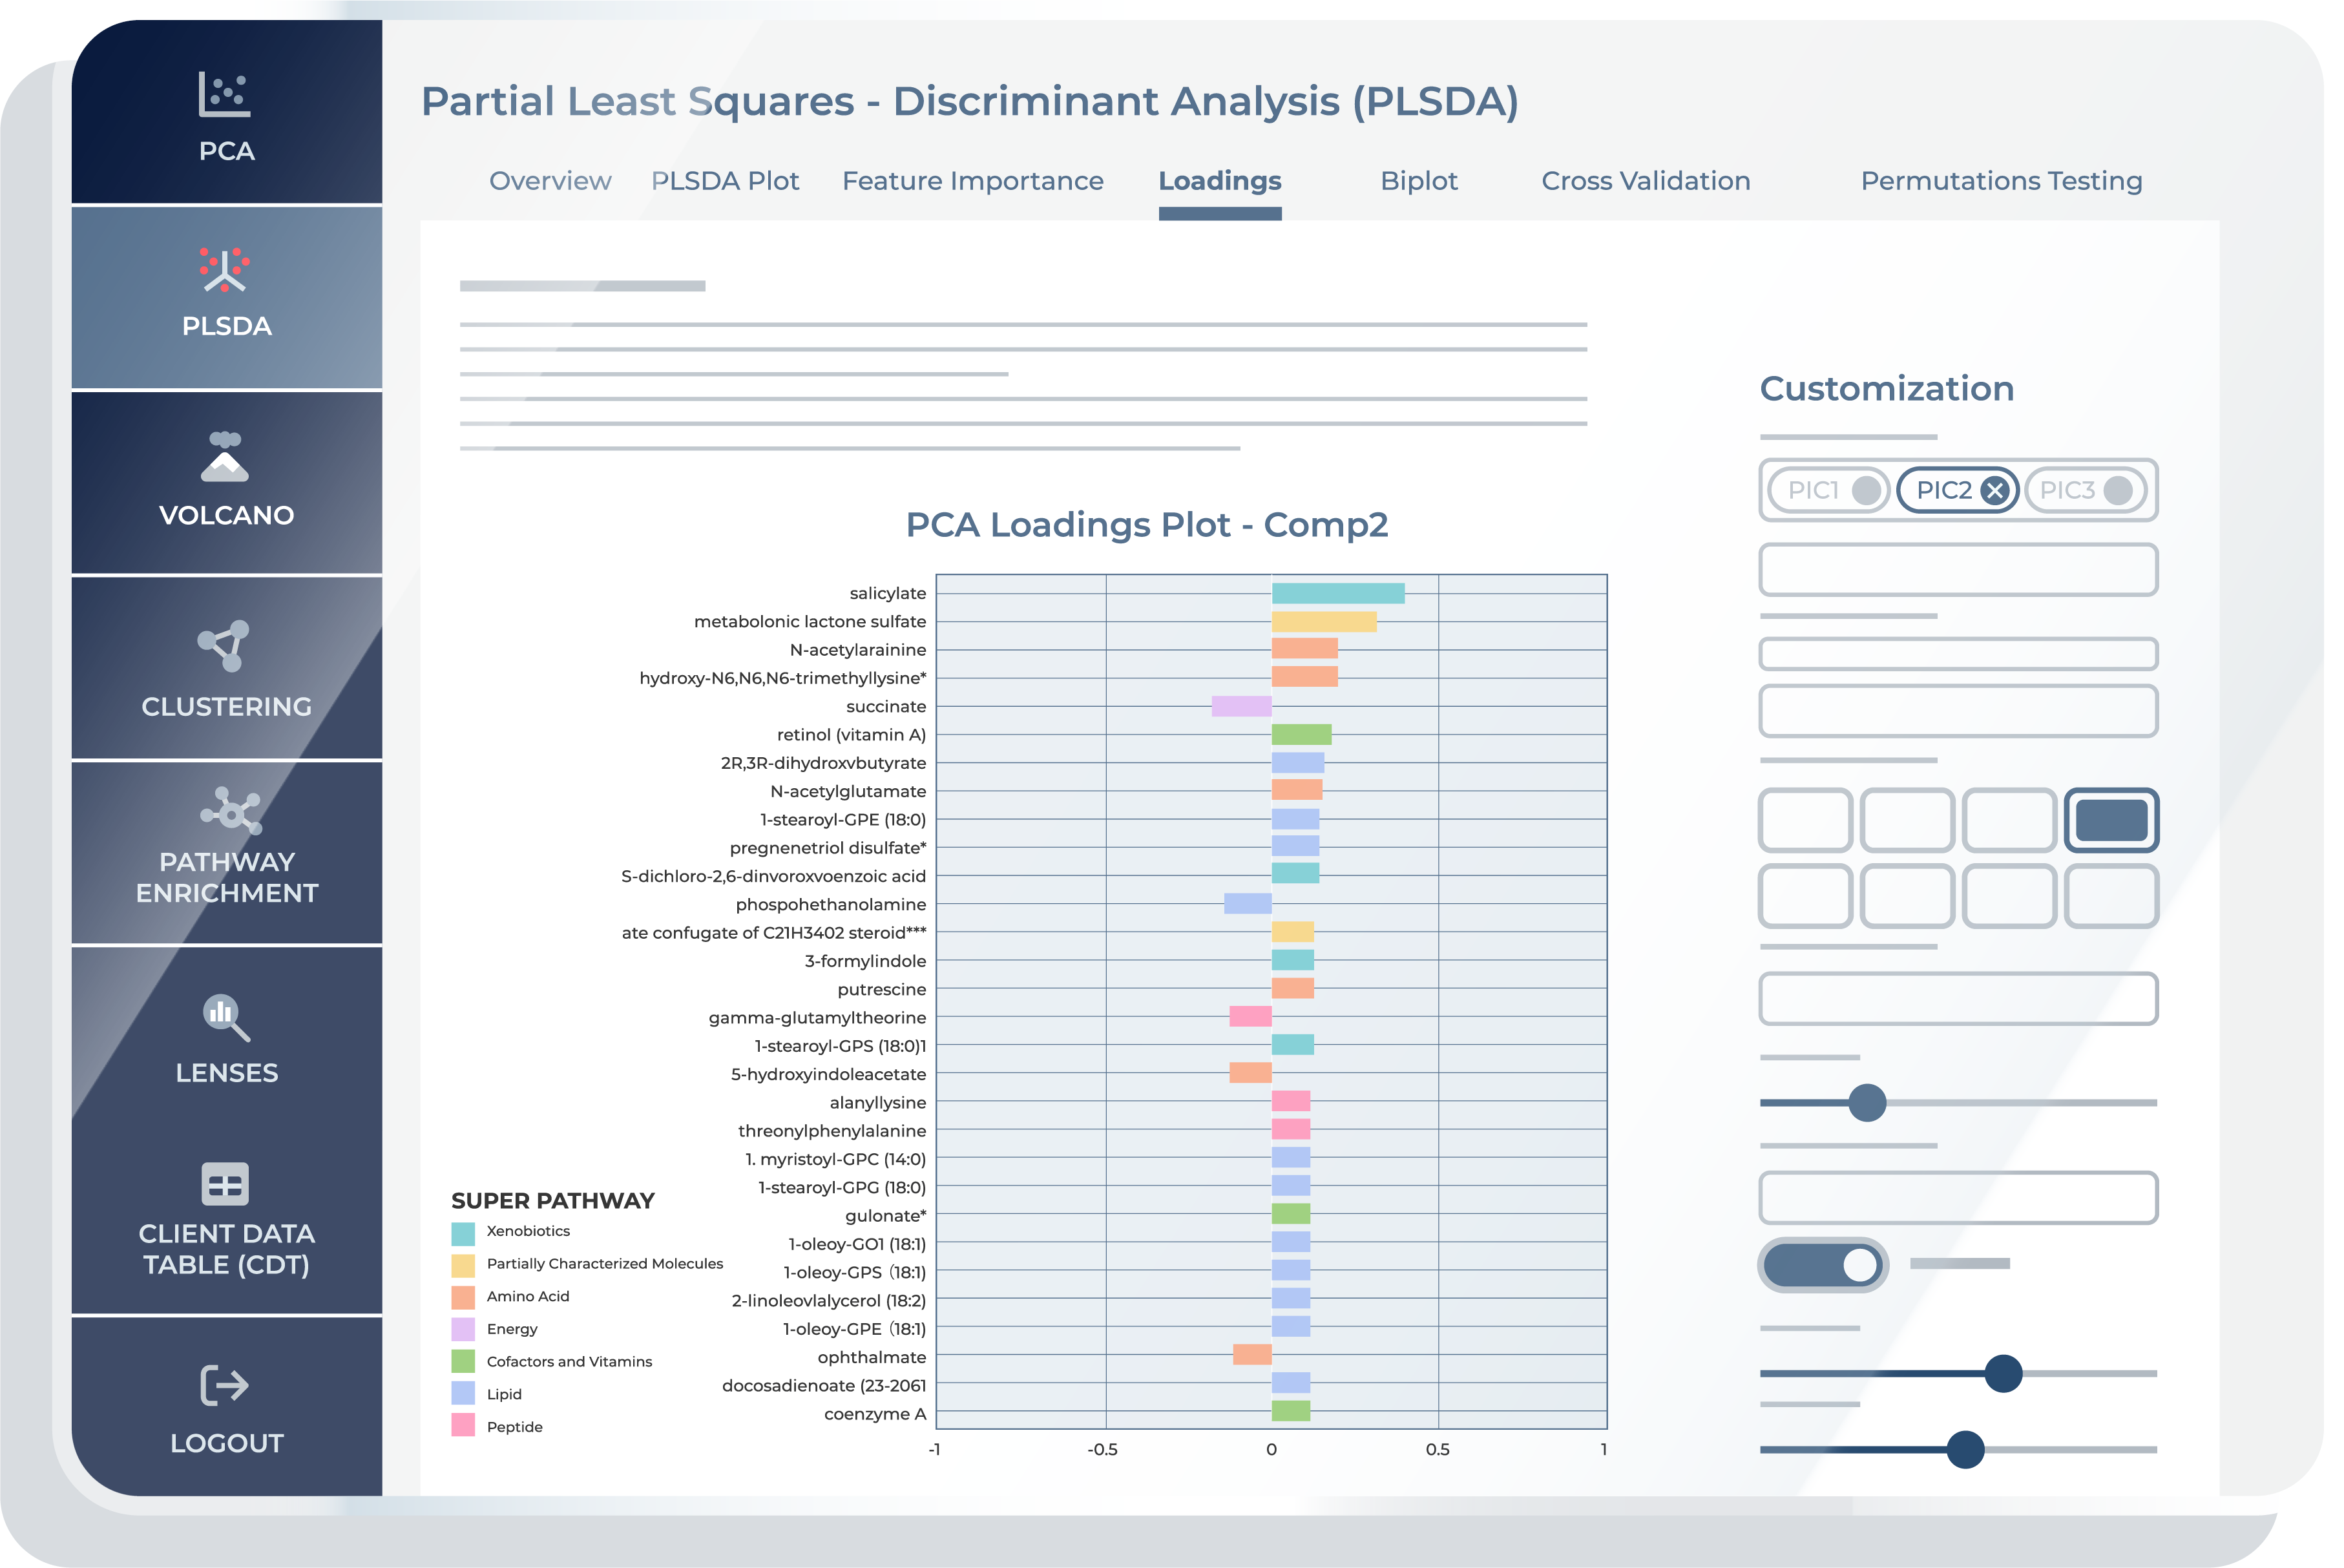
The “Loadings” feature in a PLS-DA provides you with a comprehensive view of how each metabolite contributes to the separation of different groups or conditions in your metabolomics data. While the term “loadings” is familiar from other multivariate techniques like PCA (Principal Component Analysis), it’s important to note that in the context of PLS-DA, “Loadings” take on a slightly different role. Here, they specifically highlight the metabolites that are most instrumental in achieving effective discrimination between groups. The PLS-DA “Loadings” tab is instrumental for interpreting the impact of each metabolite on the discriminant components. This functionality is essential in metabolomics for identifying metabolites that contribute significantly to the model, offering insights into the metabolic profiles that distinguish between groups like diseased vs. healthy states. High loadings on a component signify a strong association with the group separation, providing a valuable resource for biomarker discovery and understanding the metabolic underpinnings of biological processes.
Biplot
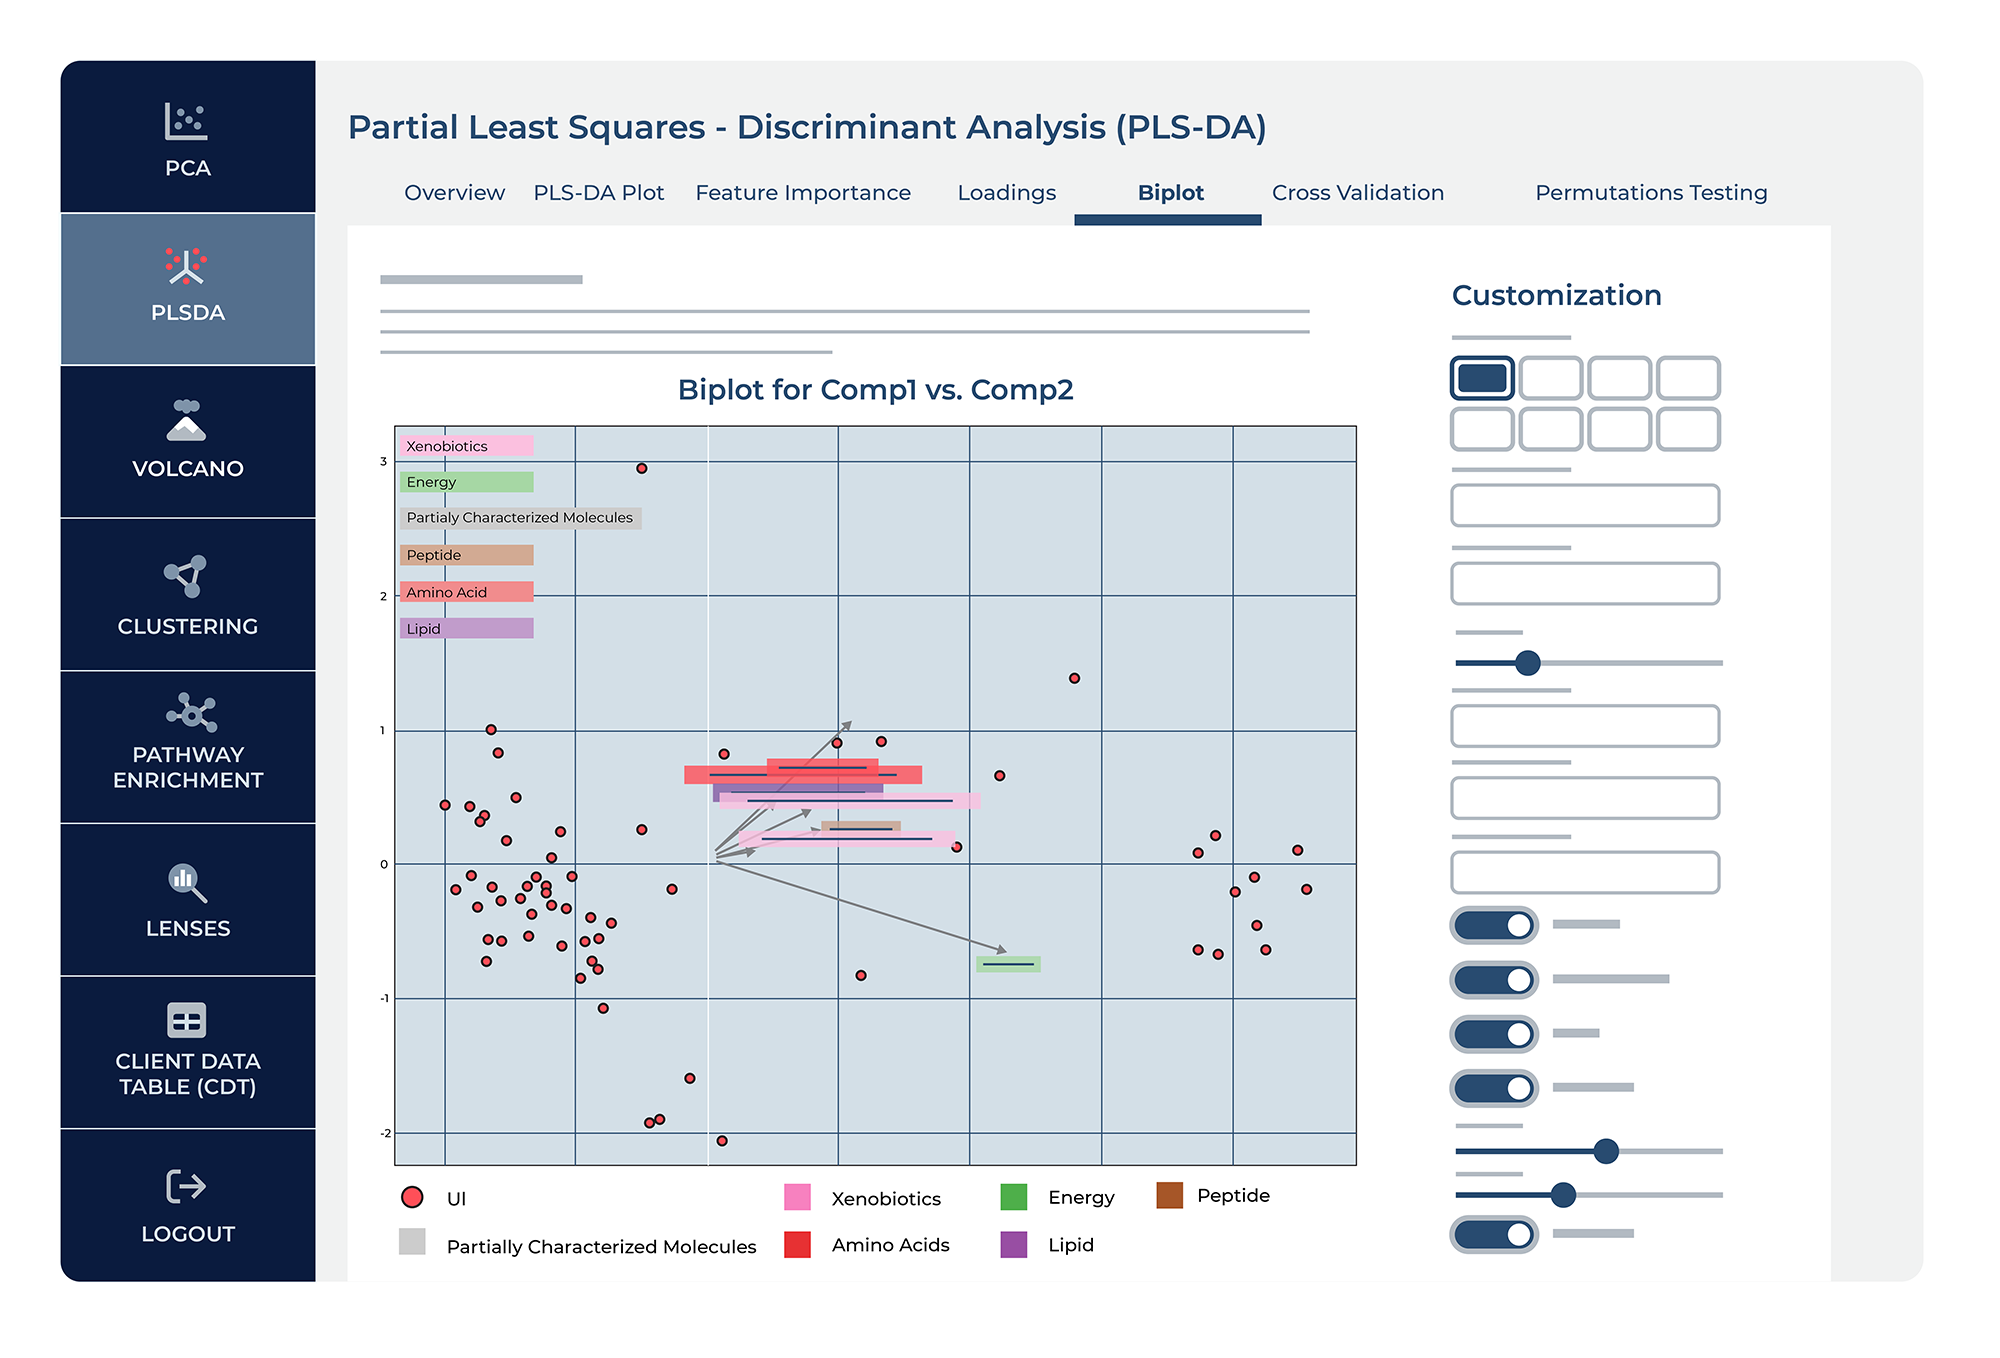
The “Biplot” feature in PLS-DA merges two critical visualizations: the scores of the samples on latent components and the loadings of the metabolites. Samples are plotted as points, while metabolite influences are depicted as vectors. The vectors’ orientation and length signal the metabolites’ correlation with each component and their relative importance. By showing how metabolites relate to each component, PLS-DA biplots provide insights into the data’s structure, highlighting the metabolites most characteristic of group separation.
Cross Validation
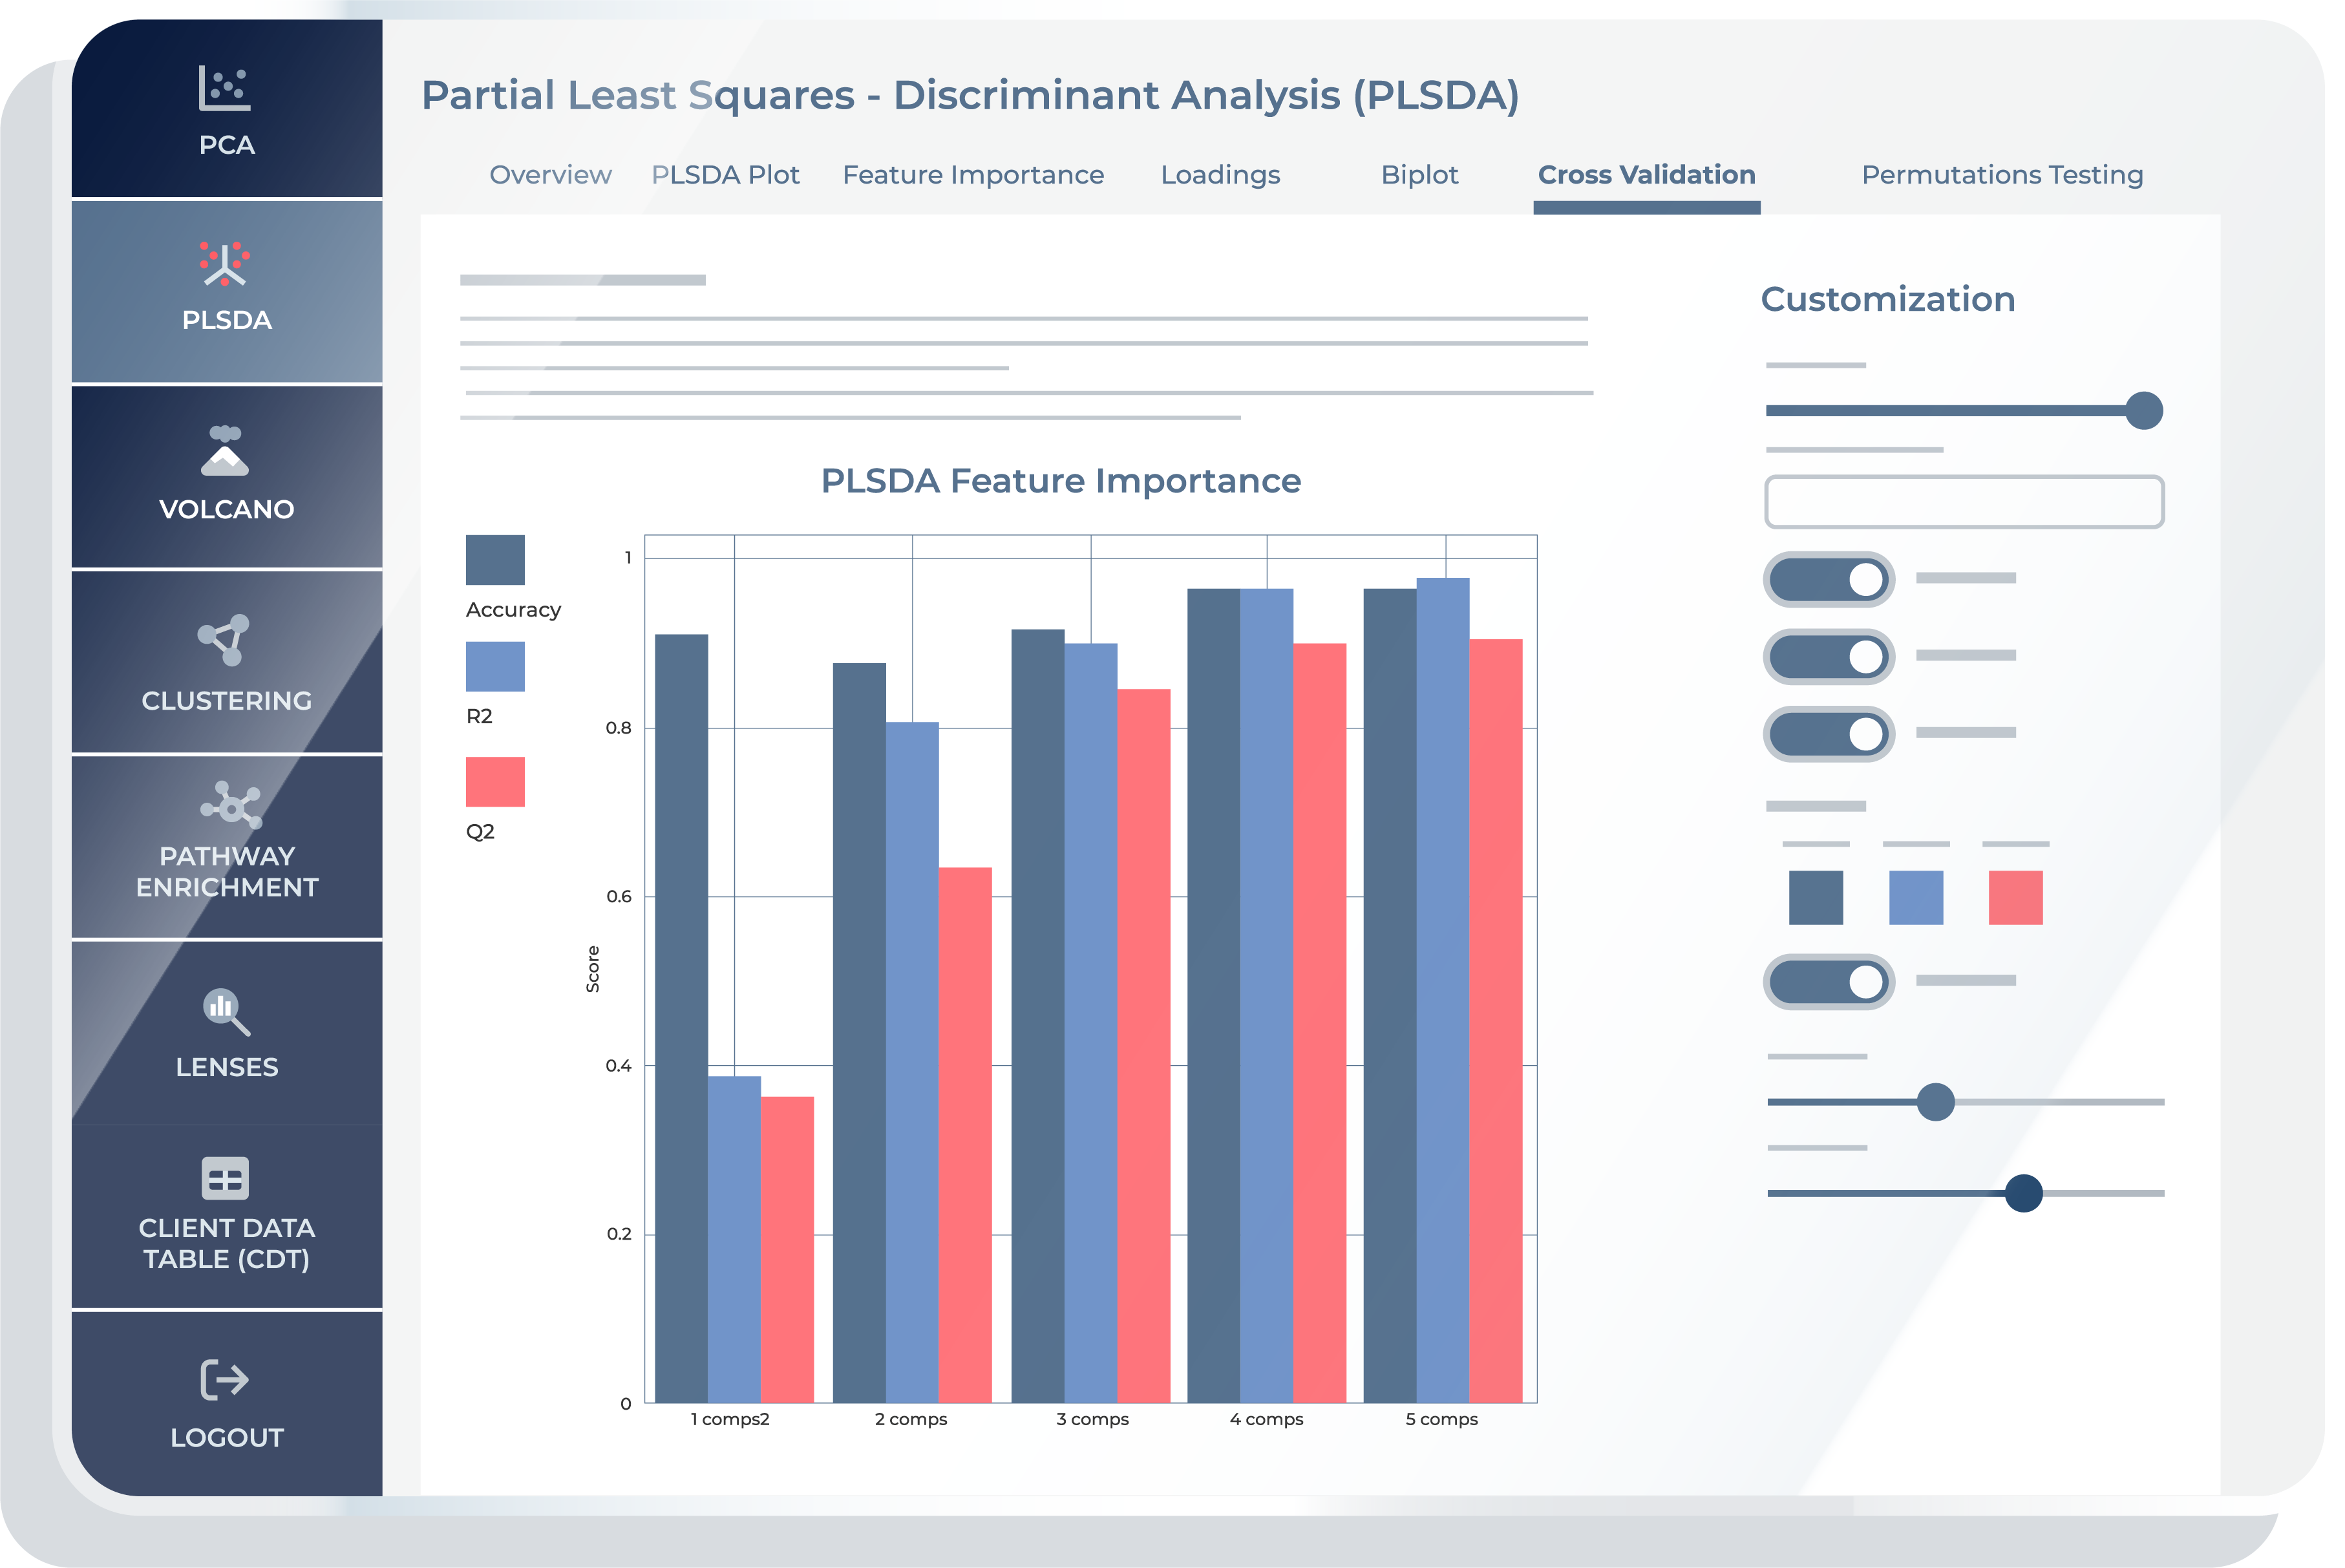
The “Cross Validation” feature provides you with critical insights into the performance and robustness of the PLS-DA model. Within this feature, you will encounter a set of interactive options that enable them to fine-tune and ensure that the model is not overfitting the data. This feature is essential for researchers seeking to validate and fine-tune their PLS-DA model, offering valuable insights into its reliability, predictive power, and suitability for their specific research objectives. By partitioning the dataset and iteratively testing the model, cross-validation assesses how well the metabolites differentiate conditions, such as diseased versus healthy states. This process is key for validating the reliability of biomarkers identified by PLS-DA and ensures the derived metabolic insights generalize beyond the sample data.
Permutation Testing
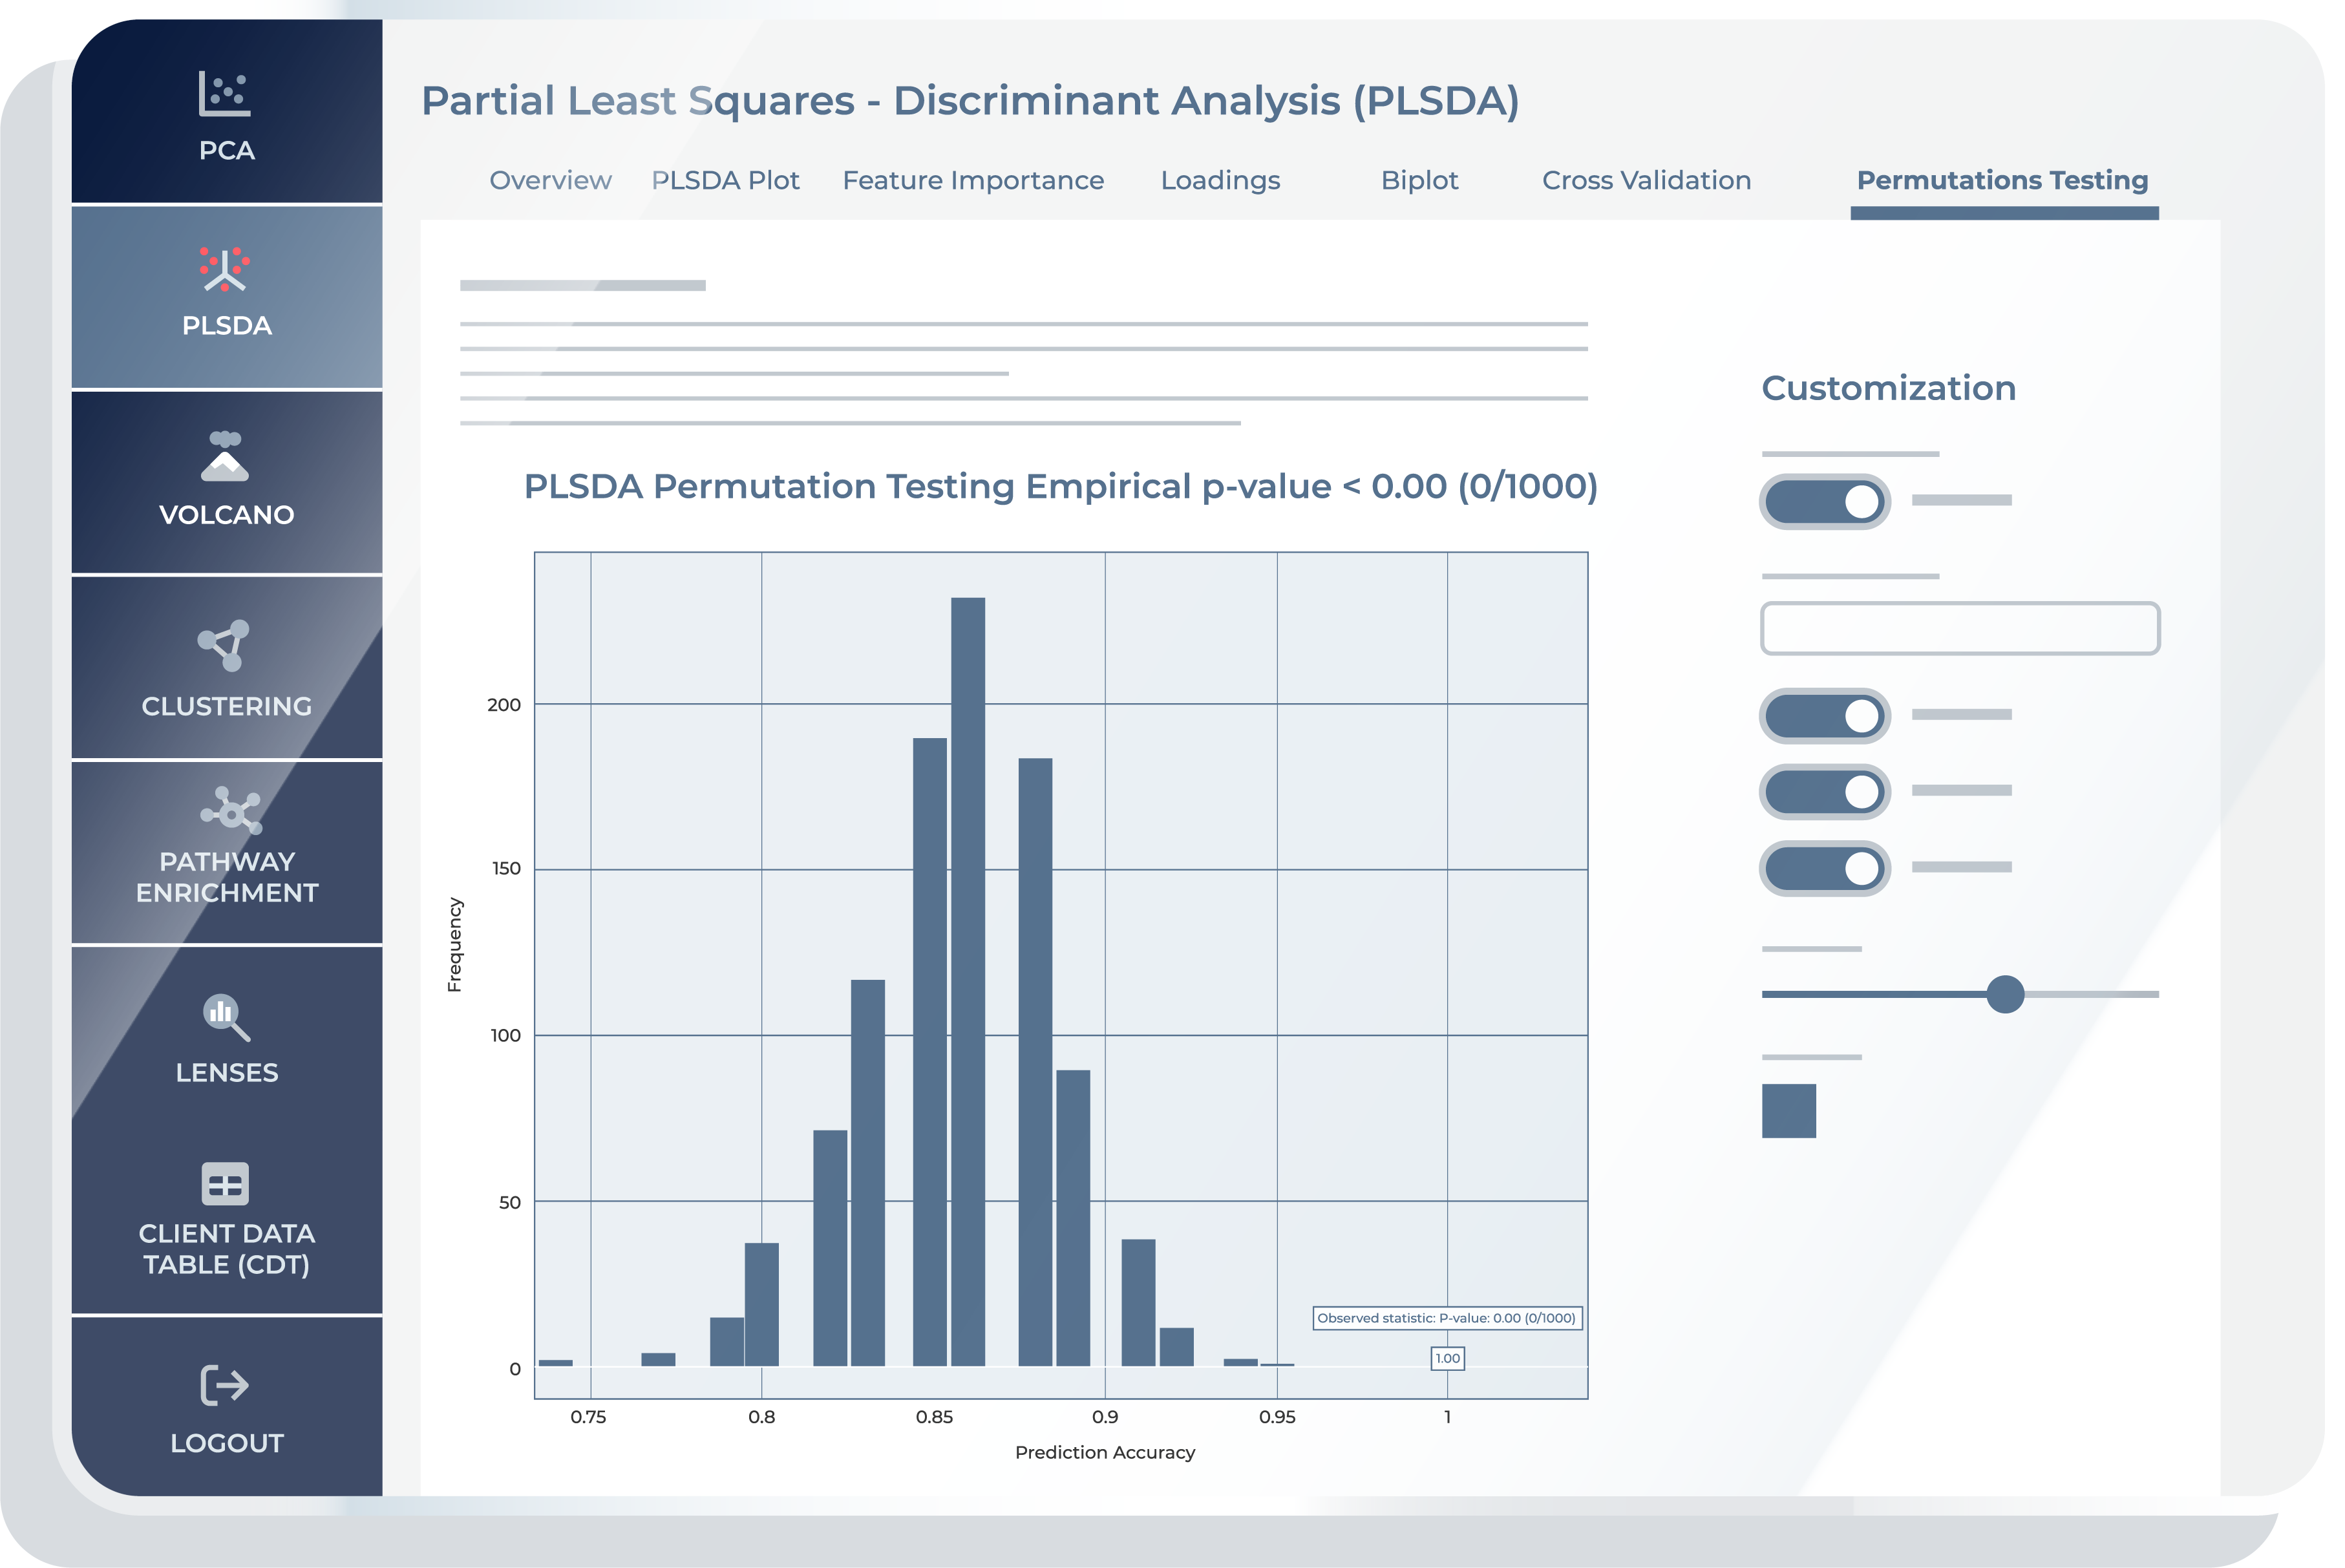
The “Permutation Testing” feature offers an evaluation of the classification model’s robustness and statistical significance. Permutation testing is a non-parametric approach used to assess the significance of a model’s results. In the context of PLS-DA, this test helps verify whether the observed classification accuracy is better than what would be expected by chance. Building on Cross-validation, it takes the evaluation a step further by assessing the model’s performance under random conditions. The key objective for “Permutation Testing” is to determine whether the classification results observed in the “Cross Validation” feature are statistically meaningful or if they could have occurred by random chance.
Bioinformatics Platform
Share this page
Demo Our Bioinformatics Platform For Free.
Contact Us
Talk with an expert
Request a quote for our services, get more information on sample types and handling procedures, request a letter of support, or submit a question about how metabolomics can advance your research.
Corporate Headquarters
617 Davis Drive, Suite 100
Morrisville, NC 27560
Mailing Address:
P.O. Box 110407
Research Triangle Park, NC 27709

