Capítulo 4
La metabolómica en la investigación traslacional
En este capítulo, aprenderás cómo la metabolómica puede ayudar a desarrollar modelos de enfermedad que reflejen con mayor precisión la biología humana; cómo puede utilizarse para caracterizar nuevos mecanismos de progresión de la enfermedad en modelos preclínicos que se trasladan con notable precisión a los pacientes humanos; y cómo puede ayudar a explicar por qué los tratamientos estándar para una enfermedad solo son parcialmente eficaces, y a qué proceso biológico se debe dirigir la intervención para subsanar esta deficiencia en la atención sanitaria.
Visión general
Al ser la «ómica» más cercana al fenotipo, la metabolómica ha aportado importantes conocimientos sobre la relación entre los factores causantes y la enfermedad. A diferencia de los genes y las proteínas, las vías bioquímicas se conservan entre especies. Por ello, la metabolómica ha sido fundamental para caracterizar biomarcadores y vías de la enfermedad en células o modelos animales que son extrapolables a los seres humanos. En este capítulo, analizaremos estudios clave en los que la metabolómica desempeñó un papel fundamental a la hora de identificar una firma biomarcadora importante o una diana terapéutica, caracterizar un mecanismo de la enfermedad que resultaba especialmente relevante en pacientes humanos, o desarrollar un nuevo modelo de enfermedad significativamente más cercano a la fisiopatología humana que los modelos existentes. Los casos prácticos de este capítulo abordan estos temas de la siguiente manera:
- Modelos de enfermedades: Estudios de caso 1, 2 y 4
- Biomarcadores: Estudios de caso 2, 3 y 4
- Mecanismos: Estudios de caso 1, 2, 3 y 4
Modelos de enfermedad, biomarcadores y mecanismos
Caso práctico 1: Desarrollo de modelos animales de dislipidemia que reflejen con precisión la biología humana
Introducción. Las enfermedades cardiovasculares (ECV) son una de las principales causas de muerte en todo el mundo, y la dislipidemia constituye un importante factor de riesgo para esta afección. Aunque las estatinas pueden resultar muy eficaces para reducir el colesterol LDL y el riesgo de ECV, muchos pacientes sufren efectos adversos, lo que pone de manifiesto la necesidad de encontrar nuevas dianas terapéuticas. Sin embargo, los esfuerzos por desarrollar tratamientos novedosos han tenido un escaso éxito clínico, lo que a menudo se atribuye a la inadecuación de los modelos animales preclínicos, que no reflejan con precisión el metabolismo lipídico humano.
Datos preliminares y objetivos del estudio. Para hacer frente a las limitaciones de los modelos animales actuales del metabolismo lipídico, los investigadores del estudio utilizaron la metabolómica para analizar y comparar los perfiles lipídicos plasmáticos en diversas especies animales y en seres humanos, con el objetivo de determinar qué modelos se asemejan más a la dislipidemia humana, tanto en condiciones basales como en respuesta al tratamiento con estatinas [12].
Métodos. Se analizaron múltiples cepas de ratones, otras especies no primates y primates no humanos, junto con seres humanos con dislipidemia. Los animales fueron alimentados con pienso estándar de laboratorio o con una dieta rica en grasas o rica en colesterol. La mayoría de las especies recibieron tratamiento con simvastatina o un control con vehículo durante dos semanas, con el fin de poder comparar los perfiles lipídicos basales con los que respondían al fármaco. Se analizaron las muestras de plasma para determinar los lípidos y las lipoproteínas mediante metabolómica. Los lípidos también se midieron mediante métodos clínicos tradicionales, incluyendo el colesterol total, el LDL, el HDL y los triglicéridos. Se utilizaron métodos basados en la distancia para cuantificar el grado de similitud de cada modelo animal con la dislipidemia humana en múltiples fracciones lipídicas.
Resultados. Se observaron diferencias sustanciales en los perfiles lipídicos plasmáticos basales entre los distintos modelos animales, y solo un subgrupo se asemejaba estrechamente a los seres humanos con dislipidemia. Los primates no humanos mostraron la mayor similitud con los seres humanos en cuanto al colesterol total, el equilibrio entre LDL y HDL y la distribución general de las lipoproteínas (Figura 22). Muchos modelos de uso común, como ratones, conejos y ratas, diferían significativamente de los humanos. Por ejemplo, muchos modelos de roedores transportaban la mayor parte del colesterol en el HDL (un perfil ateroprotector), a diferencia de los humanos, mientras que los primates no humanos y algunos modelos modificados, como los ratones que expresan CETP, mostraban patrones lipídicos más similares a los humanos. La composición de ácidos grasos en las principales clases de lípidos se conservaba en general en algunas especies, pero divergía en otras. En los seres humanos, la mayoría de los ácidos grasos procedían de las vías no esenciales y omega-6, y este patrón se replicó mejor en primates no humanos, perros y algunos modelos de roedores. Al comparar la composición lipídica general en las ocho fracciones lipídicas principales, los modelos de primates no humanos fueron los más parecidos a los seres humanos (Figura 23). En respuesta al tratamiento con simvastatina, los primates no humanos y los perros mostraron cambios lipídicos más consistentes con los de los seres humanos, mientras que la mayoría de los modelos de roedores mostraron respuestas escasas o incluso opuestas.
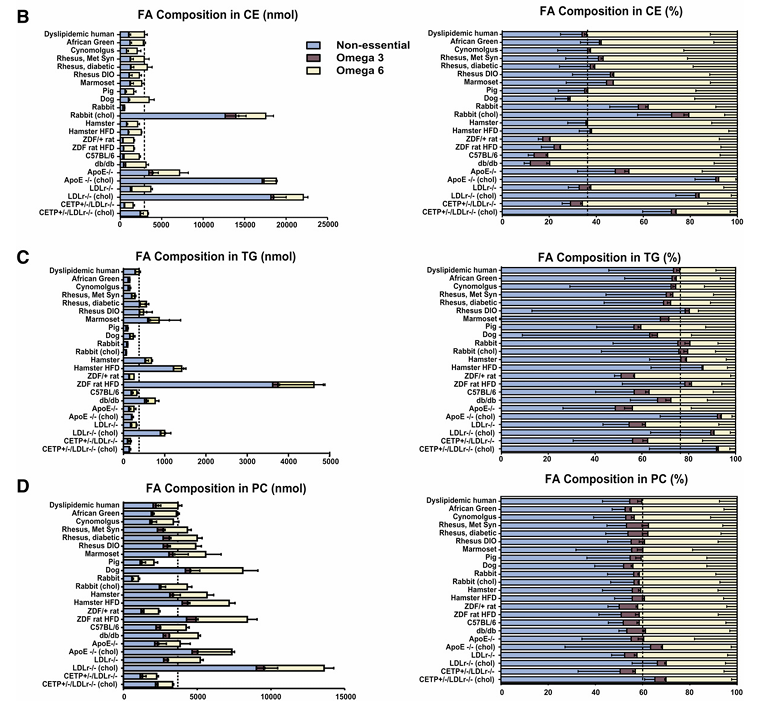
Figura 22. Composición de ácidos grasos (AG) en los ésteres de colesterol (EC), los triglicéridos (TG) y la fosfatidilcolina (PC) del plasma en diferentes especies animales. Los AG se muestran en tres categorías: AG no esenciales (azul claro), AG de la vía omega-3 (granate) y AG de la vía omega-6 (amarillo claro). Los AG medidos se sumaron para cada vía. El panel izquierdo muestra las cantidades absolutas (nmol) de AG en cada vía y el panel derecho muestra las cantidades relativas (%) para los CE plasmáticos, (A) los TG (B) y (C) las PC. Imagen reproducida de Yin et al., J Lipid Res, 2012, con licencia CC BY 4.0.
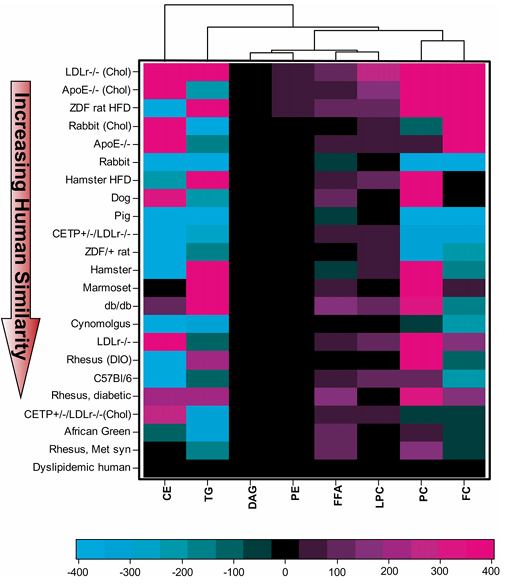
Figura 23. Comparación mediante dendrograma de la similitud de los lípidos plasmáticos basales, basada en ocho fracciones lipídicas circulantes principales (CE, TG, DAG, PE, FFA, LPC, PC y FC) entre especies. Se calculó la diferencia de cualquier fracción lipídica dada entre las medias de cada modelo animal y las de los seres humanos con dislipidemia, y se ponderó según la proporción que representaba dicha fracción lipídica sobre el total de lípidos en los seres humanos. Se calculó la distancia ponderada global de cada modelo animal con respecto a los seres humanos dislipidémicos, y los modelos se ordenaron por distancia. Imagen reproducida de Yin et al., J Lipid Res, con licencia CC BY 4.0.
Conclusiones del estudio
- Este estudio demuestra que los perfiles lipídicos iniciales y los que responden al tratamiento son fundamentales para evaluar en qué medida los modelos animales reflejan la enfermedad en humanos.
- Los primates no humanos son los modelos más representativos de la dislipidemia humana, y los perros presentan características similares en cuanto a la respuesta a los fármacos. Por el contrario, muchos modelos animales de uso generalizado, como los ratones ApoE-/- y LDLr-/- , presentaban diferencias significativas con respecto a los seres humanos.
- La metabolómica no solo permitió realizar una comparación exhaustiva de los perfiles lipídicos entre varios modelos animales y los seres humanos, sino que también demostró que la integración de los perfiles lipídicos exhaustivos (lipidómica) con los datos funcionales sobre la respuesta a los fármacos ofrece un marco más preciso para evaluar la similitud entre enfermedades y mejorar la validación de dianas terapéuticas.
Estudio de caso 2: Caracterización de los mecanismos de la enfermedad de Niemann-Pick que reflejan el fenotipo de los pacientes humanos
Introducción. La enfermedad de Niemann-Pick tipo C1 (NPC1) es un trastorno neurodegenerativo raro y progresivo causado principalmente por mutaciones en el gen NPC1 que provocan una alteración del transporte intracelular del colesterol y la acumulación de lípidos en los lisosomas. La enfermedad suele manifestarse en la infancia con ataxia y deterioro cognitivo y, sin una intervención oportuna, los pacientes suelen fallecer a causa de ella en la adolescencia. Uno de los principales retos en el tratamiento de la enfermedad de NPC1 es la falta de una prueba diagnóstica sencilla y no invasiva, lo que a menudo puede retrasar el diagnóstico varios años.
Datos preliminares y objetivos del estudio. La enfermedad NPC1 está estrechamente relacionada con el estrés oxidativo, tal y como demuestran el aumento de las especies reactivas del oxígeno (ROS) y la peroxidación lipídica en modelos celulares y animales, así como la reducción de la capacidad antioxidante en los pacientes. El entorno oxidativo, combinado con un exceso de colesterol celular, favorece la formación de productos de oxidación del colesterol (oxisteroles). Basándose en estos hallazgos descritos anteriormente, los investigadores de este estudio plantearon la hipótesis de que los productos de oxidación del colesterol circulantes podrían servir como biomarcadores sanguíneos sensibles y específicos para la enfermedad NPC1 [13]. El objetivo de este estudio fue determinar si los oxisteroles en plasma podían distinguir a los pacientes con la enfermedad NPC1 de los individuos sanos y si los niveles de oxisteroles se correlacionan con la gravedad de la enfermedad.
Métodos. Se utilizaron ratones Npc1-/- y un modelo felino de la enfermedad NPC1 para evaluar los oxisteroles como biomarcadores de dicha enfermedad. Se recogieron muestras de plasma, tejido hepático y cerebral, y líquido cefalorraquídeo (LCR) de los animales a lo largo de su vida. Paralelamente, se recogieron muestras de plasma humano, LCR y fibroblastos de pacientes con la enfermedad NPC1, controles sanos, portadores heterocigotos de una mutación del gen NPC1 e individuos con otras enfermedades de almacenamiento lisosomal para evaluar la especificidad de los biomarcadores. Los oxisteroles se midieron mediante metabolómica dirigida. Las diferencias en los niveles de oxisteroles y la correlación con la gravedad de la enfermedad se determinaron mediante ANOVA y análisis de correlación.
Resultados. Se observó un aumento significativo de múltiples oxisteroles en el plasma y los tejidos de los ratones Npc1-/-; este aumento fue moderado antes de la aparición de los síntomas neurológicos y se acentuó a medida que la enfermedad avanzaba. En sujetos humanos, los oxisteroles no enzimáticos 3β,5α,6β-triol y 7-cetocolesterol (7-KC) se incrementaron significativamente en pacientes con NPC1 en comparación con los controles y los portadores heterocigotos, lo que permitió detectar casos con alta sensibilidad y especificidad. Estos biomarcadores diferenciaron claramente a los pacientes con NPC1 de los individuos sanos y de aquellos con otros trastornos de almacenamiento lisosomal (Figura 24). Las concentraciones más elevadas de 3β,5α,6β-triol y 7-KC se asociaron con un inicio más precoz de la enfermedad y una mayor gravedad de la misma, y un índice que combinaba estos marcadores mejoró la capacidad predictiva. En el modelo felino de NPC1, el tratamiento con ciclodextrina redujo significativamente los niveles de oxisteroles, lo que demostró que estos biomarcadores también pueden servir para evaluar la respuesta terapéutica (Figura 25).
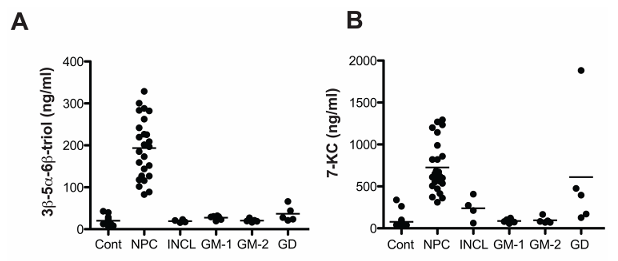
Figura 24. Comparación de las concentraciones plasmáticas de oxisteroles en la enfermedad NPC1 y otras enfermedades de almacenamiento lisosomal. Concentraciones de (A) 3β,5α,6β-triol y (B) 7-KC en muestras de plasma en ayunas de sujetos del grupo de control, con NPC1, lipofuscinosis neuronal infantil (INCL), gangliosidosis GM-1 (GM-1), gangliosidosis GM-2 (GM-2) y enfermedad de Gaucher (GD). Imagen reproducida de Proter et al., Sci Transl Med, 2010, con licencia CC BY 4.0.
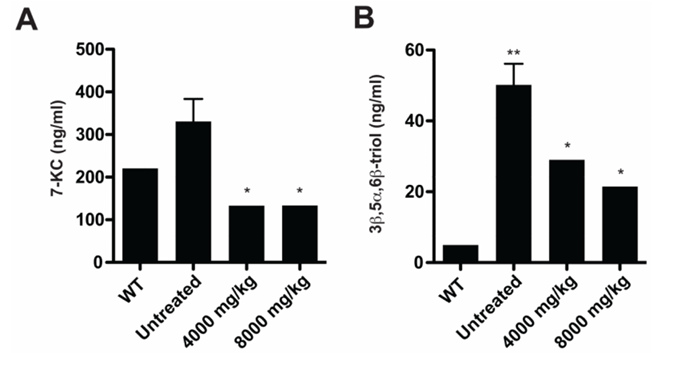
Figura 25. Los biomarcadores de oxisteroles circulantes disminuyen en respuesta al tratamiento con ciclodextrina. (A) Se midieron las concentraciones séricas de 7-KC y (B) 3β,5α,6β-triol en gatos WT (4-16 semanas) y NPC1 (16 semanas) no tratados, y en gatos NPC1 (16-18 semanas) tratados con una única inyección subcutánea de 4000 u 8000 mg/kg a las 3 semanas (n = 2-4/grupo). Imagen reproducida de Proter et al., Sci Transl Med, 2010, con licencia CC BY 4.0
Conclusiones del estudio
- Este estudio demuestra que los oxisteroles son biomarcadores altamente sensibles y específicos de la enfermedad NPC1, lo que responde a una importante necesidad no cubierta en el diagnóstico y el seguimiento de esta enfermedad.
- A diferencia de otras enfermedades en las que el aumento de los oxisteroles es moderado, la NPC1 presenta elevaciones importantes y específicas de la enfermedad que permiten distinguirla claramente de los grupos de control y de otros trastornos.
- Dado que los oxisteroles guardan relación con la gravedad de la enfermedad y la edad de aparición, también podrían resultar útiles para hacer un seguimiento de la evolución de la enfermedad. La reducción observada en los niveles de oxisteroles tras el tratamiento en modelos animales sugiere que podrían servir como criterios de valoración sustitutivos en ensayos clínicos para ayudar a evaluar la eficacia terapéutica.
Estudio de caso 3: Caracterización de las interacciones entre el intestino y el cerebro propias de las personas con trastorno del espectro autista
Introducción. En la actualidad, el trastorno del espectro autista (TEA) se diagnostica basándose en criterios conductuales más que en marcadores biológicos, lo que contribuye a retrasar el diagnóstico y limita las oportunidades de intervención temprana. La creciente prevalencia del TEA y la falta de tratamientos aprobados por la FDA para los síntomas principales exigen la identificación de biomarcadores moleculares objetivos que permitan una detección más temprana y respalden las terapias personalizadas. El TEA se asocia cada vez más con anomalías metabólicas, entre las que se incluyen la disfunción mitocondrial y el estrés oxidativo. Sin embargo, los resultados de estudios previos han sido inconsistentes debido al reducido tamaño de las muestras, la cobertura limitada de metabolitos y la variabilidad en el diseño de los estudios, lo que ha obstaculizado los intentos de identificar firmas metabólicas consistentes. La dieta y la microbiota intestinal añaden complejidad, ya que pueden moldear significativamente los perfiles de metabolitos e interactuar con factores de riesgo genéticos para influir en la biología del TEA.
Datos preliminares y objetivos del estudio. Para subsanar estas lagunas de conocimiento, los investigadores se propusieron realizar análisis metabolómicos exhaustivos de muestras de plasma y heces procedentes de una amplia cohorte de niños con TEA, junto con un grupo de control neurotípico [14]. El objetivo de este estudio era identificar patrones metabólicos sólidos asociados al TEA y caracterizar las relaciones entre el metabolismo y los síntomas conductuales.
Métodos. Los participantes tenían entre 3 y 12 años. Los diagnósticos de TEA se confirmaron mediante herramientas clínicas estandarizadas y se seleccionaron controles neurotípicos para garantizar un desarrollo típico. A un subgrupo de participantes también se le realizó una evaluación de los síntomas gastrointestinales (GI) con el fin de estratificar a las personas con TEA en grupos con y sin disfunción GI para realizar análisis adicionales. Se analizaron muestras de plasma y heces mediante metabolómica global y un perfil lipídico complejo. Las diferencias metabólicas entre los grupos del estudio se determinaron mediante comparaciones basadas en el ANOVA. Se utilizó el aprendizaje automático Random Forest para determinar si los perfiles metabólicos podían distinguir a los pacientes con TEA de los controles. Además, se trasplantó la microbiota fecal de donantes con TEA y neurotípicos a ratones libres de gérmenes para examinar si las firmas metabólicas asociadas al microbioma podían transferirse y proporcionar información sobre las interacciones intestino-cerebro.
Resultados. Se observaron diferencias en cientos de metabolitos entre los grupos, y los perfiles metabólicos permitieron distinguir de forma moderada a las personas con TEA de las neurotípicas, siendo los metabolitos clave para la discriminación los lípidos, las hormonas esteroides y los compuestos de origen microbiano. Los niveles alterados de acilcarnitinas y de metabolitos relacionados con la energía sugirieron un deterioro del metabolismo energético celular; además, se observaron alteraciones en las vías de los aminoácidos y del glutatión, compatibles con un aumento del estrés oxidativo (Figura 26). Muchas de estas vías metabólicas alteradas se correlacionaban con las puntuaciones de gravedad del comportamiento, lo que vinculaba las anomalías metabólicas con las características clínicas del TEA. Varios metabolitos de origen microbiano, incluido el sulfato de 4-etilfenilo, presentaban niveles elevados en el TEA y algunos eran transferibles a ratones mediante trasplante de microbiota fecal, lo que sugiere una contribución causal de los microbios intestinales a los cambios metabólicos (Figura 27).
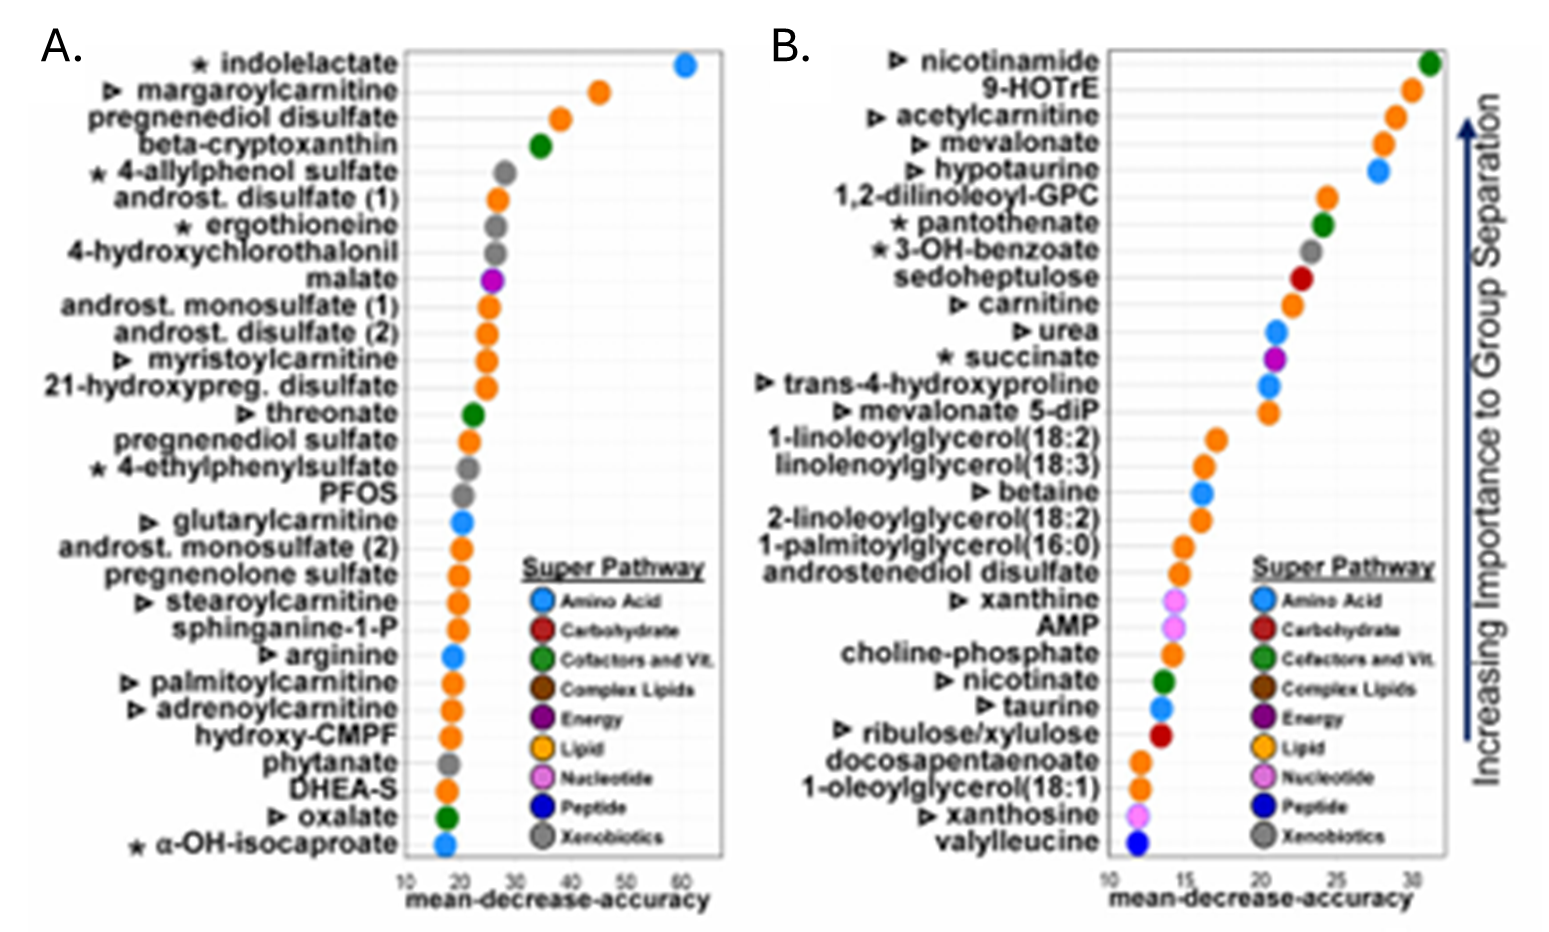
Figura 26. Los metabolomas plasmáticos y fecales difieren entre los grupos con TEA y los neurotípicos. Los 30 metabolitos más distintivos entre cada grupo en plasma (A) y heces (B) según un análisis de bosque aleatorio, con la precisión media de disminución representada en el eje x. Imagen reproducida de Needham et al., Biol Psychiatry, 2021, bajo licencia CC BY 4.0
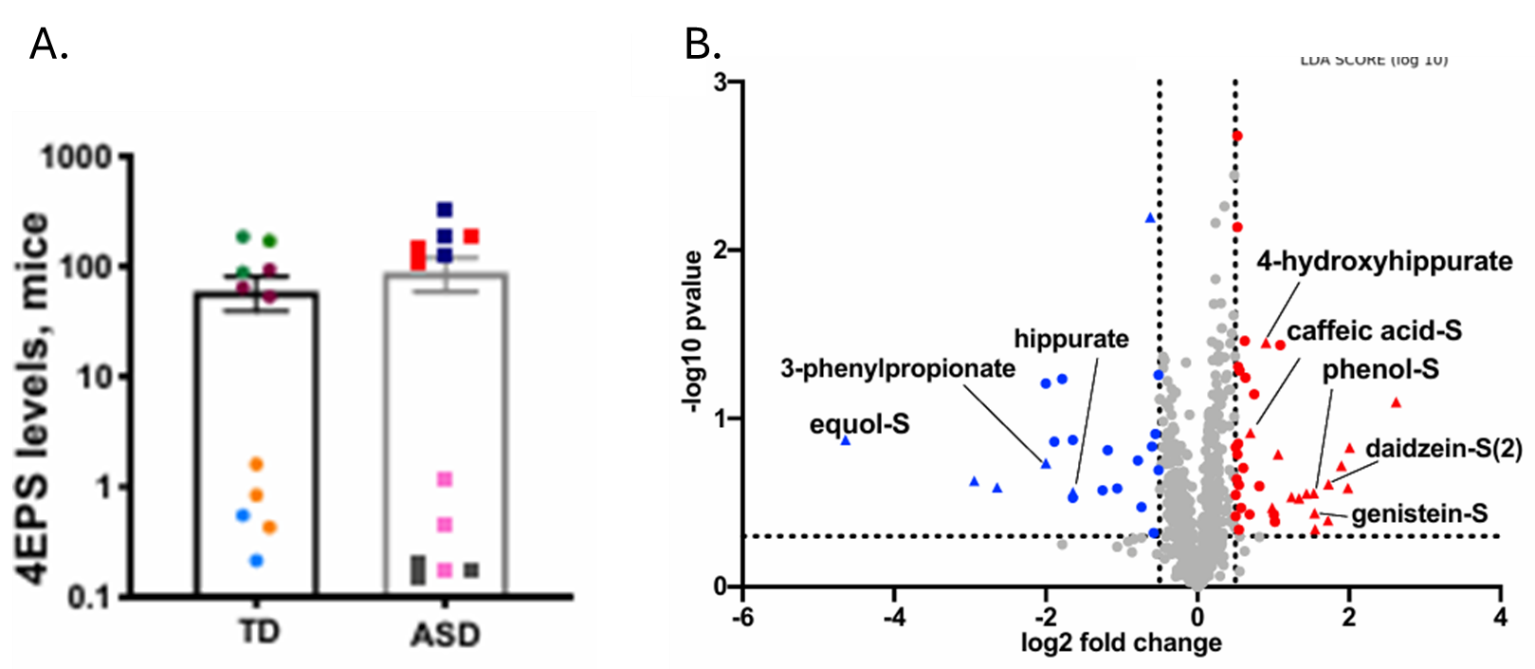
Figura 27. Trasplante de microbiota fecal humana a ratones. (A) Valores de intensidad normalizados que indican los niveles relativos de sulfato de 4-etilfenilo (4EPS) en ratones colonizados con donantes neurotípicos o con TEA, coloreados según el donante. (B) Valores de intensidad normalizados que indican los niveles relativos de 4EPS en ratones colonizados con donantes neurotípicos o con TEA, coloreados según el donante. Imagen reproducida de Needham et al., Biol Psychiatry, 2021, con licencia CC BY 4.0.
Conclusiones del estudio
- Este estudio reveló diversos perfiles metabólicos relacionados con los síntomas gastrointestinales y las puntuaciones conductuales, lo que sugiere que el TEA no puede explicarse mediante un único mecanismo, sino que está determinado por el riesgo genético, la dieta y la microbiota intestinal.
- Muchos de los metabolitos alterados procedían de los microbios intestinales o se veían afectados por ellos. Se demostró que algunas de esas firmas metabólicas podían transferirse a ratones mediante trasplantes de microbiota, lo que sugiere que el intestino y el sistema inmunitario pueden influir en la función cerebral a través de los metabolitos circulantes.
- En general, este estudio sugiere que la integración de la metabolómica con datos clínicos y ambientales podría mejorar el diagnóstico del TEA y, potencialmente, identificar nuevas dianas terapéuticas.
Caso práctico 4: Aclaración de un nuevo mecanismo que explica por qué los tratamientos de referencia para la linfangioleiomiomatosis son parciales y reversibles
Introducción. La linfangioleiomiomatosis (LAM) es una enfermedad pulmonar rara y progresiva que afecta principalmente a las mujeres y se caracteriza por una proliferación anómala de células similares al músculo liso, lo que provoca la destrucción quística del pulmón y la insuficiencia respiratoria. La LAM está relacionada con mutaciones en los genes del complejo de la esclerosis tuberosa (TSC1/TSC2), que provocan una hiperactivación de la vía de señalización mTORC1, un regulador clave del crecimiento celular y el metabolismo. Sin embargo, la activación de mTORC1 por sí sola no explica completamente la patogénesis de la LAM, ya que los beneficios clínicos de los inhibidores de mTOR, como la rapamicina, son incompletos y reversibles. El notable predominio femenino de la LAM apunta a un papel del estradiol en la progresión de la enfermedad.
Datos preliminares y objetivos del estudio. Estudios previos han demostrado que el estradiol puede potenciar el crecimiento tumoral y la metástasis en modelos con deficiencia de TSC2, lo que sugiere una contribución hormonal a la biología de la enfermedad. Además, también se ha sugerido que las vías que involucran a mediadores inflamatorios son mediadores importantes de la biología de la enfermedad. Los investigadores plantearon la hipótesis de que la biosíntesis de prostaglandinas, impulsada por la enzima COX-2, podría ser una vía clave que vincula la señalización de los estrógenos con la pérdida de TSC2. El objetivo de este estudio fue determinar cómo interactúan el estradiol, la deficiencia de TSC2 y la señalización de mTOR para regular la COX-2 y la producción de prostaglandinas, y si esta vía podría servir como diana terapéutica en la LAM [15].
Métodos. Se llevaron a cabo estudios mecanísticos utilizando líneas celulares con deficiencia de TSC2 y controles con «reintroducción» de TSC2. Las células se trataron con estradiol y diversos inhibidores de las vías de señalización. Se midieron parámetros como la expresión de COX-2, la activación de las vías de señalización y la producción de prostaglandinas mediante inmunotransferencia, ELISA y RT-PCR. Se utilizó la silenciación génica (p. ej., shRNA contra Rictor) para evaluar el papel de la señalización de mTORC2. La metabolómica global identificó cambios en las prostaglandinas y los metabolitos lipídicos relacionados tras el tratamiento con estradiol. Se implantaron células con deficiencia de TSC2 y células con TSC2 restaurado en ratones Tsc+/- para evaluar el crecimiento tumoral, la producción de prostaglandinas y las respuestas al tratamiento. Se trató a los ratones con aspirina o celecoxib para evaluar el impacto terapéutico de la inhibición de la COX-2. Se analizaron tejido pulmonar, suero, orina y condensado de aire exhalado de pacientes con LAM para validar los hallazgos y evaluar la relevancia de la actividad de la COX-2 y la señalización de las prostaglandinas en la enfermedad humana.
Resultados. El estradiol aumentó significativamente la producción de prostaglandinas en las células con deficiencia de TSC2, revelando una firma metabólica distintiva caracterizada por niveles elevados de prostaglandinas y metabolitos relacionados. En las células con deficiencia de TSC2, las vías de señalización MAPK y PI3K-Akt fueron activadas por el estradiol, lo que elevó la expresión de COX-2, lo que sugiere una relación mecánica entre la señalización de los estrógenos y el metabolismo lipídico inflamatorio en la LAM. El aumento de la expresión de COX-2 y la biosíntesis de prostaglandinas se produjo independientemente de la señalización de mTORC1. Curiosamente, la rapamicina inhibió la actividad de mTORC1, pero no redujo los niveles de COX-2 ni la producción de prostaglandinas, mientras que la inhibición de mTORC2 redujo significativamente la expresión de COX-2 y la señalización posterior. En modelos murinos, la inhibición farmacológica de la COX-2 con aspirina o celecoxib redujo los niveles de prostaglandinas, suprimió el crecimiento tumoral y aumentó la apoptosis en modelos preclínicos (Figura 28). En muestras humanas de LAM, la expresión de COX-2 y las prostaglandinas circulantes estaban elevadas, y el tratamiento con aspirina aumentó los niveles de mediadores lipídicos antiinflamatorios, lo que redujo la proliferación celular.
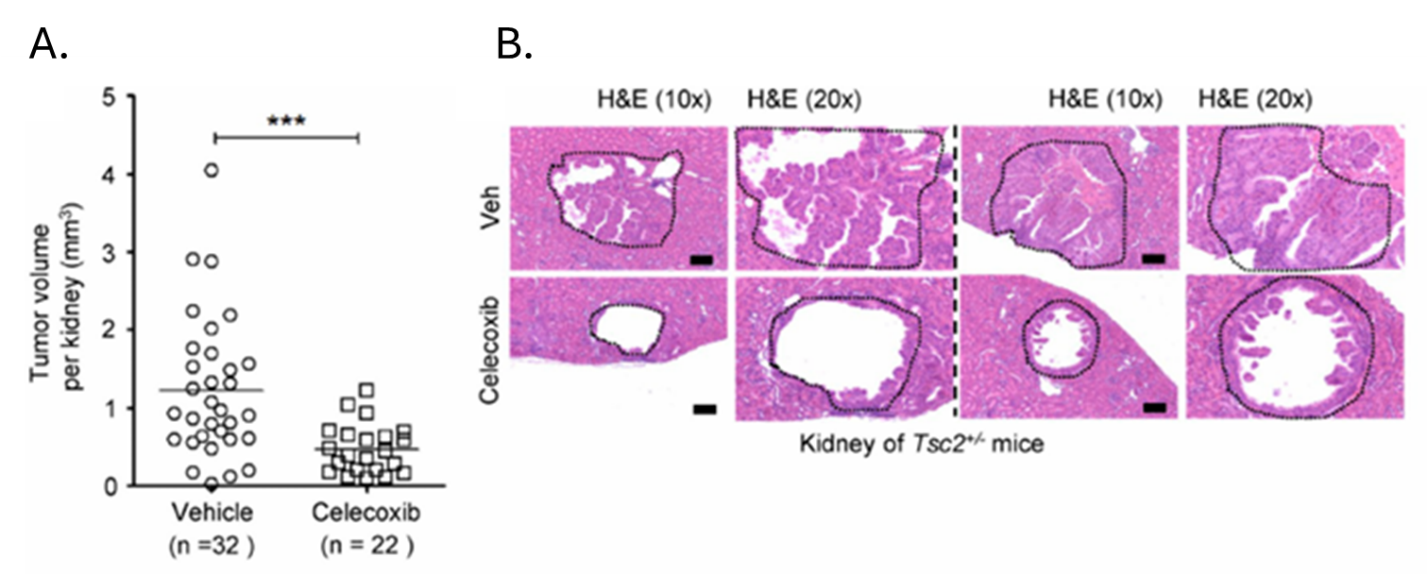
Figura 28. La inhibición de la COX-2 suprime la tumorigénesis renal e inhibe la progresión del tumor xenoinjertado de células con deficiencia de TSC2 en modelos preclínicos. Se trató a ratones Tsc2+/2 con un vehículo o con celecoxib (0,1 % en la dieta para ratones) durante un mes y, posteriormente, se les sacrificó para su análisis al finalizar el tratamiento. Se evaluaron la histología del cistadenoma renal y las puntuaciones tumorales renales microscópicas. (A) Las puntuaciones tumorales renales microscópicas se representan en una escala lineal (P = 0,0002). Se analizan los datos de 16 grupos tratados con vehículo y 11 con celecoxib. (B) Se muestran dos cistadenomas. Los resultados son representativos de 11 o 16 ratones por grupo. Imagen reproducida de Li et al., J Exp Med, 2014, con licencia CC BY 4.0.
Conclusiones del estudio
- Este estudio ha identificado una nueva relación entre la señalización del estrógeno, la pérdida de TSC2 y el metabolismo de las prostaglandinas en la LAM.
- Las terapias que inhiben la COX-2 frenaron el crecimiento tumoral y aumentaron la apoptosis en un modelo murino de LAM. También se observó una reducción de la proliferación celular en respuesta a los tratamientos inhibidores de la COX-2 en células humanas obtenidas de pacientes con LAM.
- Aunque anteriormente se creía que la LAM estaba impulsada principalmente por la activación de mTORC1, estos hallazgos demostraron que la producción de prostaglandinas mediada por la COX-2 es un mecanismo independiente de mTORC1 que contribuye a la progresión de la enfermedad, lo que explica por qué los tratamientos estándar, como la rapamicina, solo proporcionan beneficios clínicos parciales.
Conclusiones del capítulo
- Debido a su posición como la disciplina más cercana al fenotipo, la metabolómica resulta especialmente útil para caracterizar mecanismos biológicos e identificar biomarcadores y dianas terapéuticas en modelos preclínicos que se trasladan con notable éxito a los seres humanos.
- La aplicación de la metabolómica a los estudios traslacionales podría mejorar la tasa de éxito de los ensayos clínicos, especialmente en el caso de aquellas enfermedades para las que se han propuesto numerosas terapias que, sin embargo, han fracasado en los estudios clínicos debido a la falta de modelos traslacionales sólidos.
Descarga la guía completa en formato PDF
Descargue esta completa guía desarrollada para enseñarle los entresijos de una de las herramientas ómicas más potentes de la caja de herramientas de cualquier científico: la metabolómica.
Descargar ahoraPóngase en contacto con nosotros
Hable con un experto
Solicite un presupuesto para nuestros servicios, obtenga más información sobre tipos de muestras y procedimientos de manipulación, solicite una carta de apoyo o envíe una pregunta sobre cómo la metabolómica puede hacer avanzar su investigación.
Sede social
617 Davis Drive, Suite 100
Morrisville, NC 27560
Dirección postal:
P.O. Box 110407
Research Triangle Park, NC 27709
+1 (919) 572-1711
Sede internacional
Metabolon GmbH
Zeppelinstraße 3
85399 Hallbergmoos
Alemania