
PLS-DA Features
- Visión general
- Gráfico PLS-DA
- Función Importancia
- Cargas
- Biplot
- Validación cruzada
- Pruebas de permutación
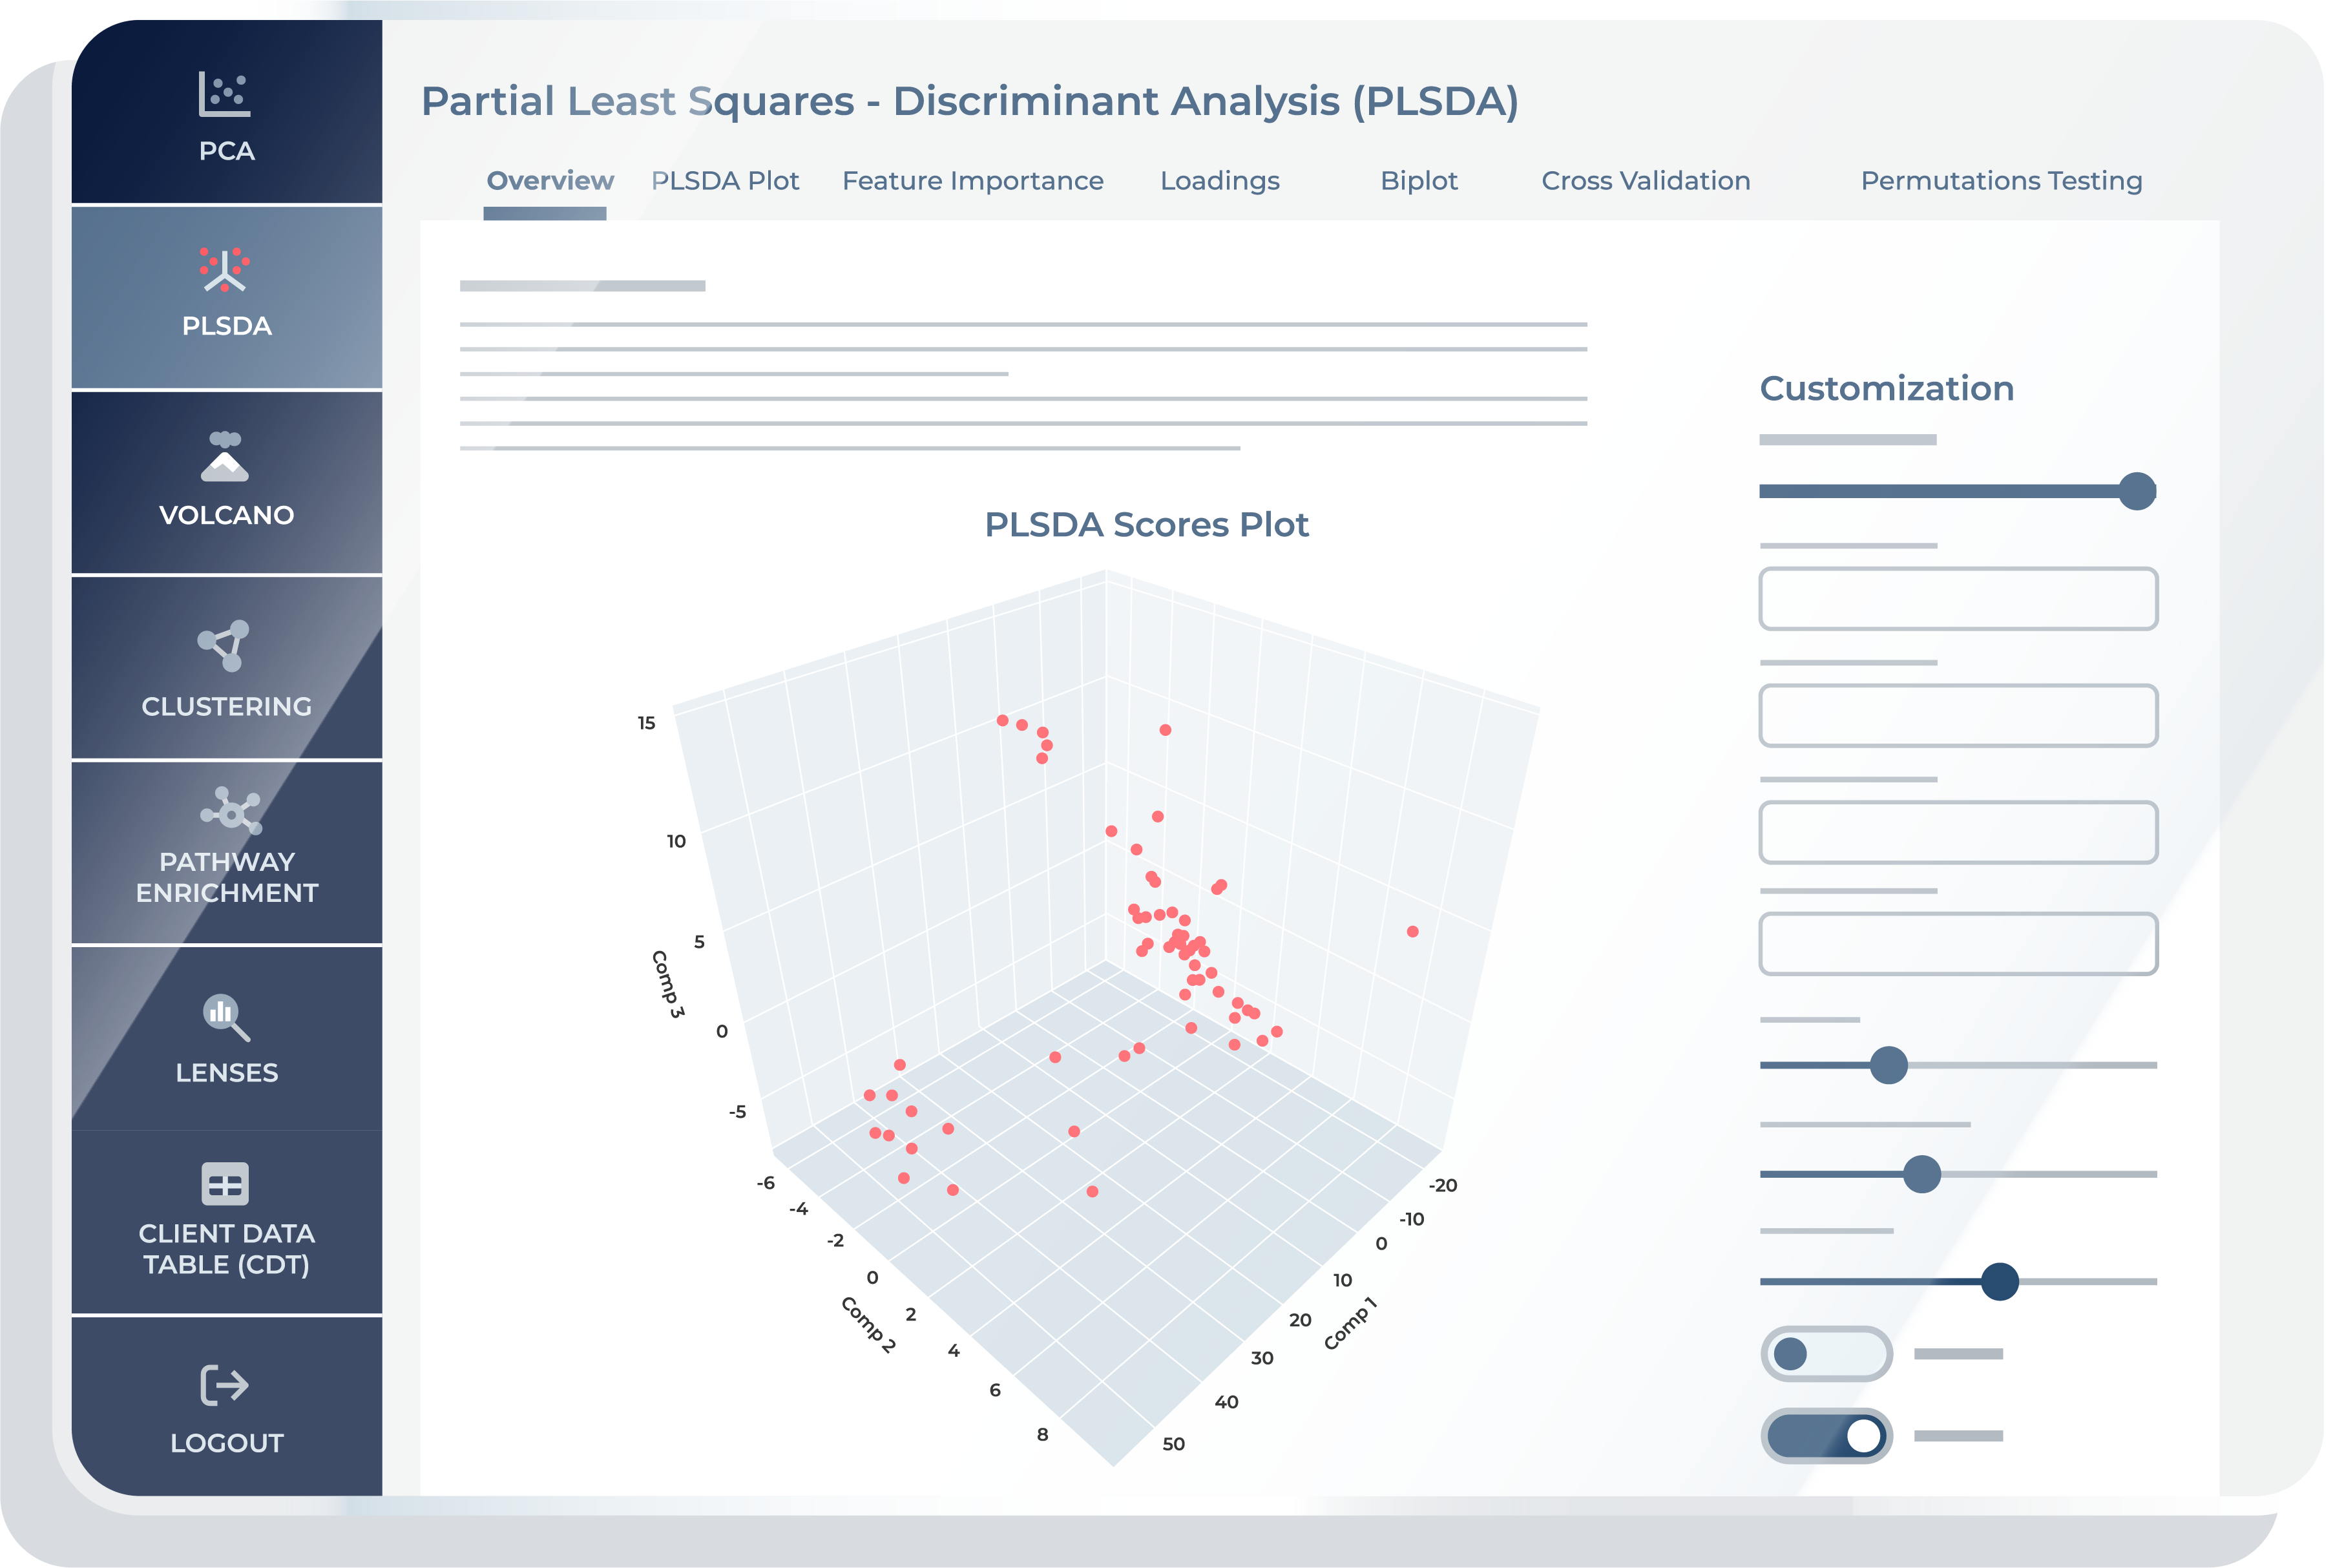
The “Overview” feature is designed to provide you with a bird’s-eye view of component interactions and guide you in deciding which specific component comparisons warrant closer inspection. It serves as an initial exploration tool, helping you identify key areas of interest, potential outliers, or potential groupings before diving into more detailed analyses.
This initial assessment assists you in formulating hypotheses and determining the focus of your subsequent investigations in the PLS-DA. Following this broad analysis, you can delve into the subsequent features, which provide more detailed visualizations and insights. These additional features are instrumental for in-depth hypothesis development and for exploring specific aspects of the PLS analysis in greater detail, thereby enhancing the overall analytical process.
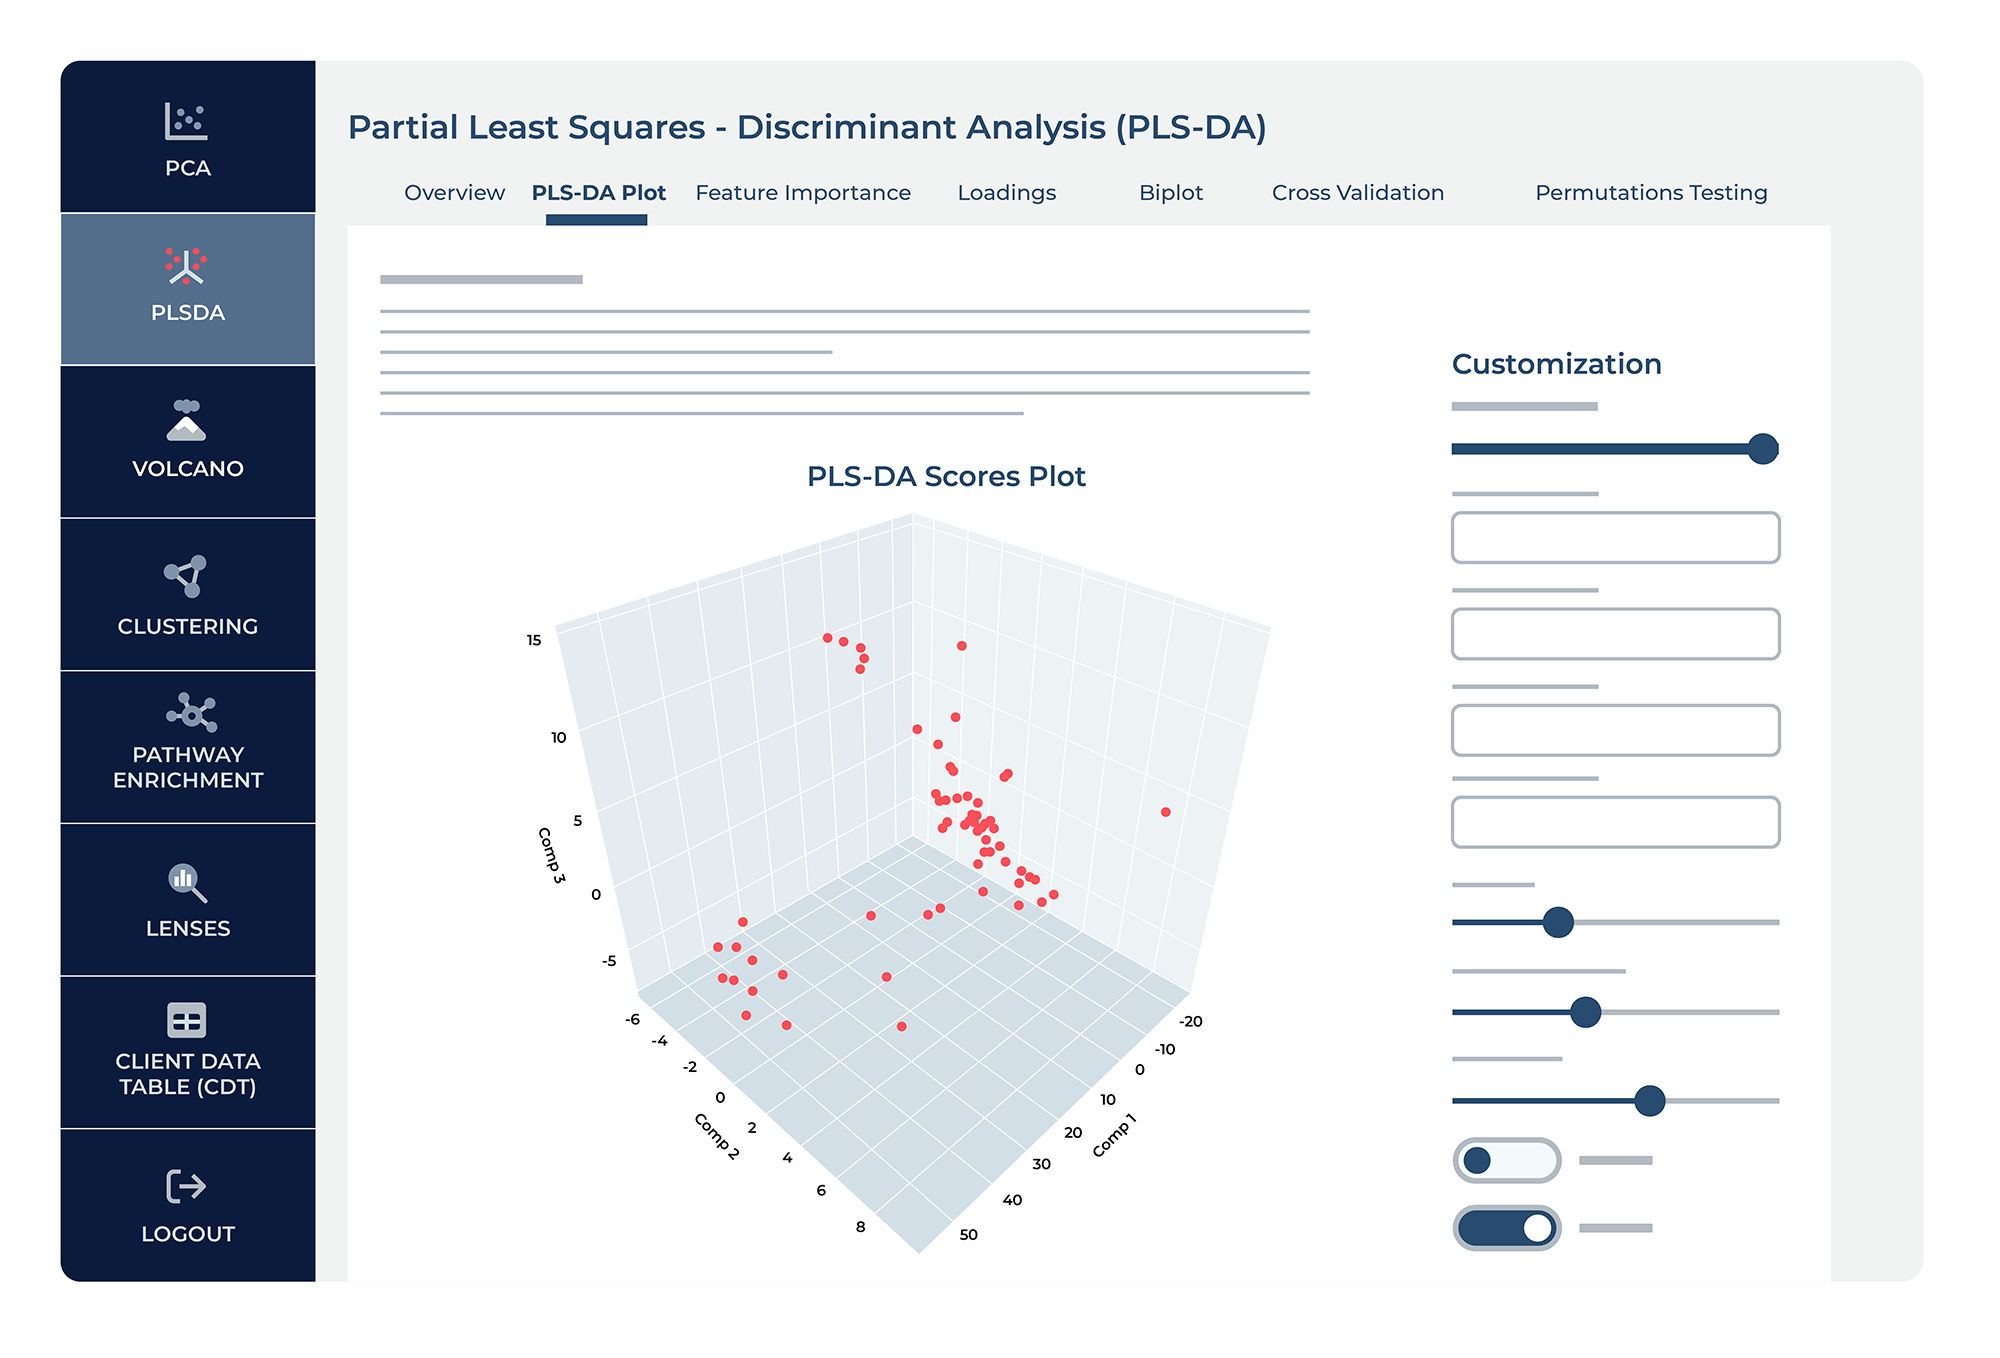
The PLS-DA plot feature allows you to go into more detail on PLS comparisons. This feature allows you to select any two components for a 2D plot or three components for a 3D plot, providing a customizable view of your PLS-DA results. One of the key benefits of this feature is the ability to assign color to data points based on specific groups or conditions, which aids in visually assessing how well the model discriminates between these groups.
Additionally, you can choose to shape data points by another variable, further enhancing the interpretability of the plot. Further refine your analysis by removing outlier samples to dynamically recalculate and plot the components.
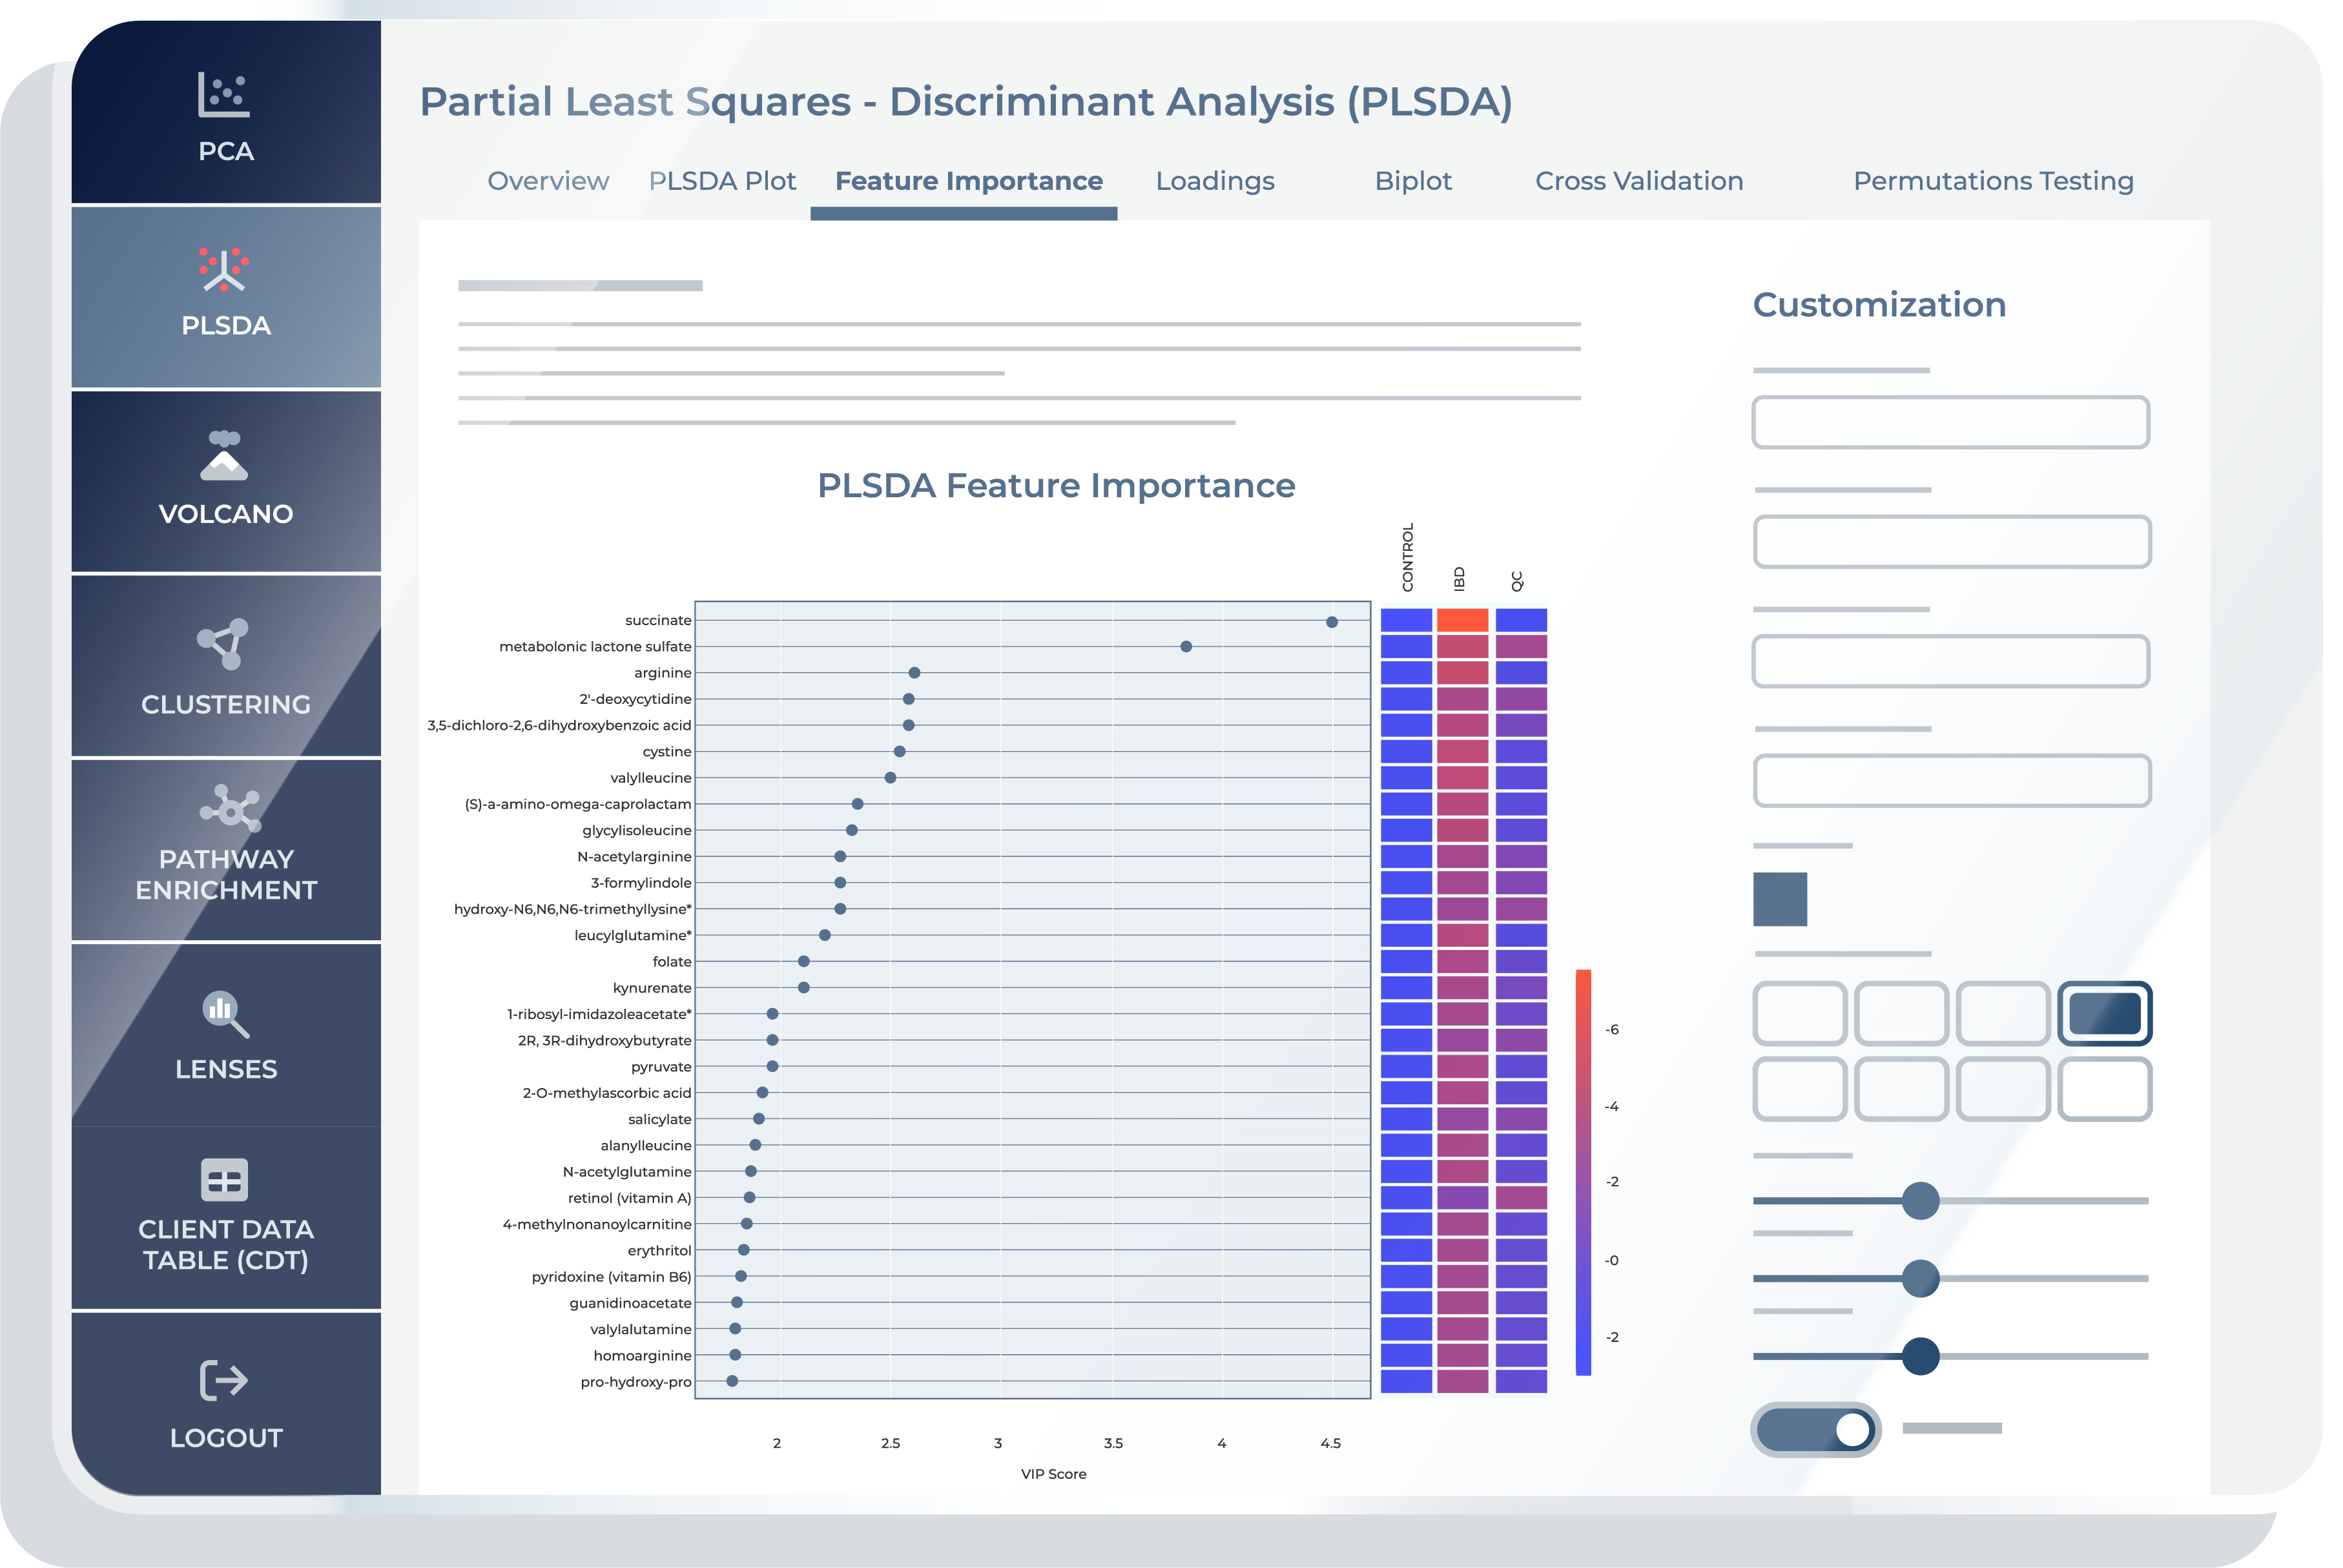
“Feature Importance” is a crucial step if you are seeking to identify the key metabolites that drive the discrimination between different groups or conditions in your metabolomics data. This feature presents VIP (Variable Importance in Projection) scores, ranking the metabolites based on their significance in the PLS-DA model’s ability to classify or discriminate between the chosen groups. You can customize the number of top metabolites displayed, providing a focused view of the most influential variables.
In addition to VIP scores, “Feature Importance” includes a heatmap visualization for each group or condition selected, displaying the abundance profiles of the selected top metabolites. These heatmaps offer you an intuitive means of understanding how the identified metabolites vary across different groups, facilitating the identification of trends, patterns, and potential biomarkers associated with specific conditions.
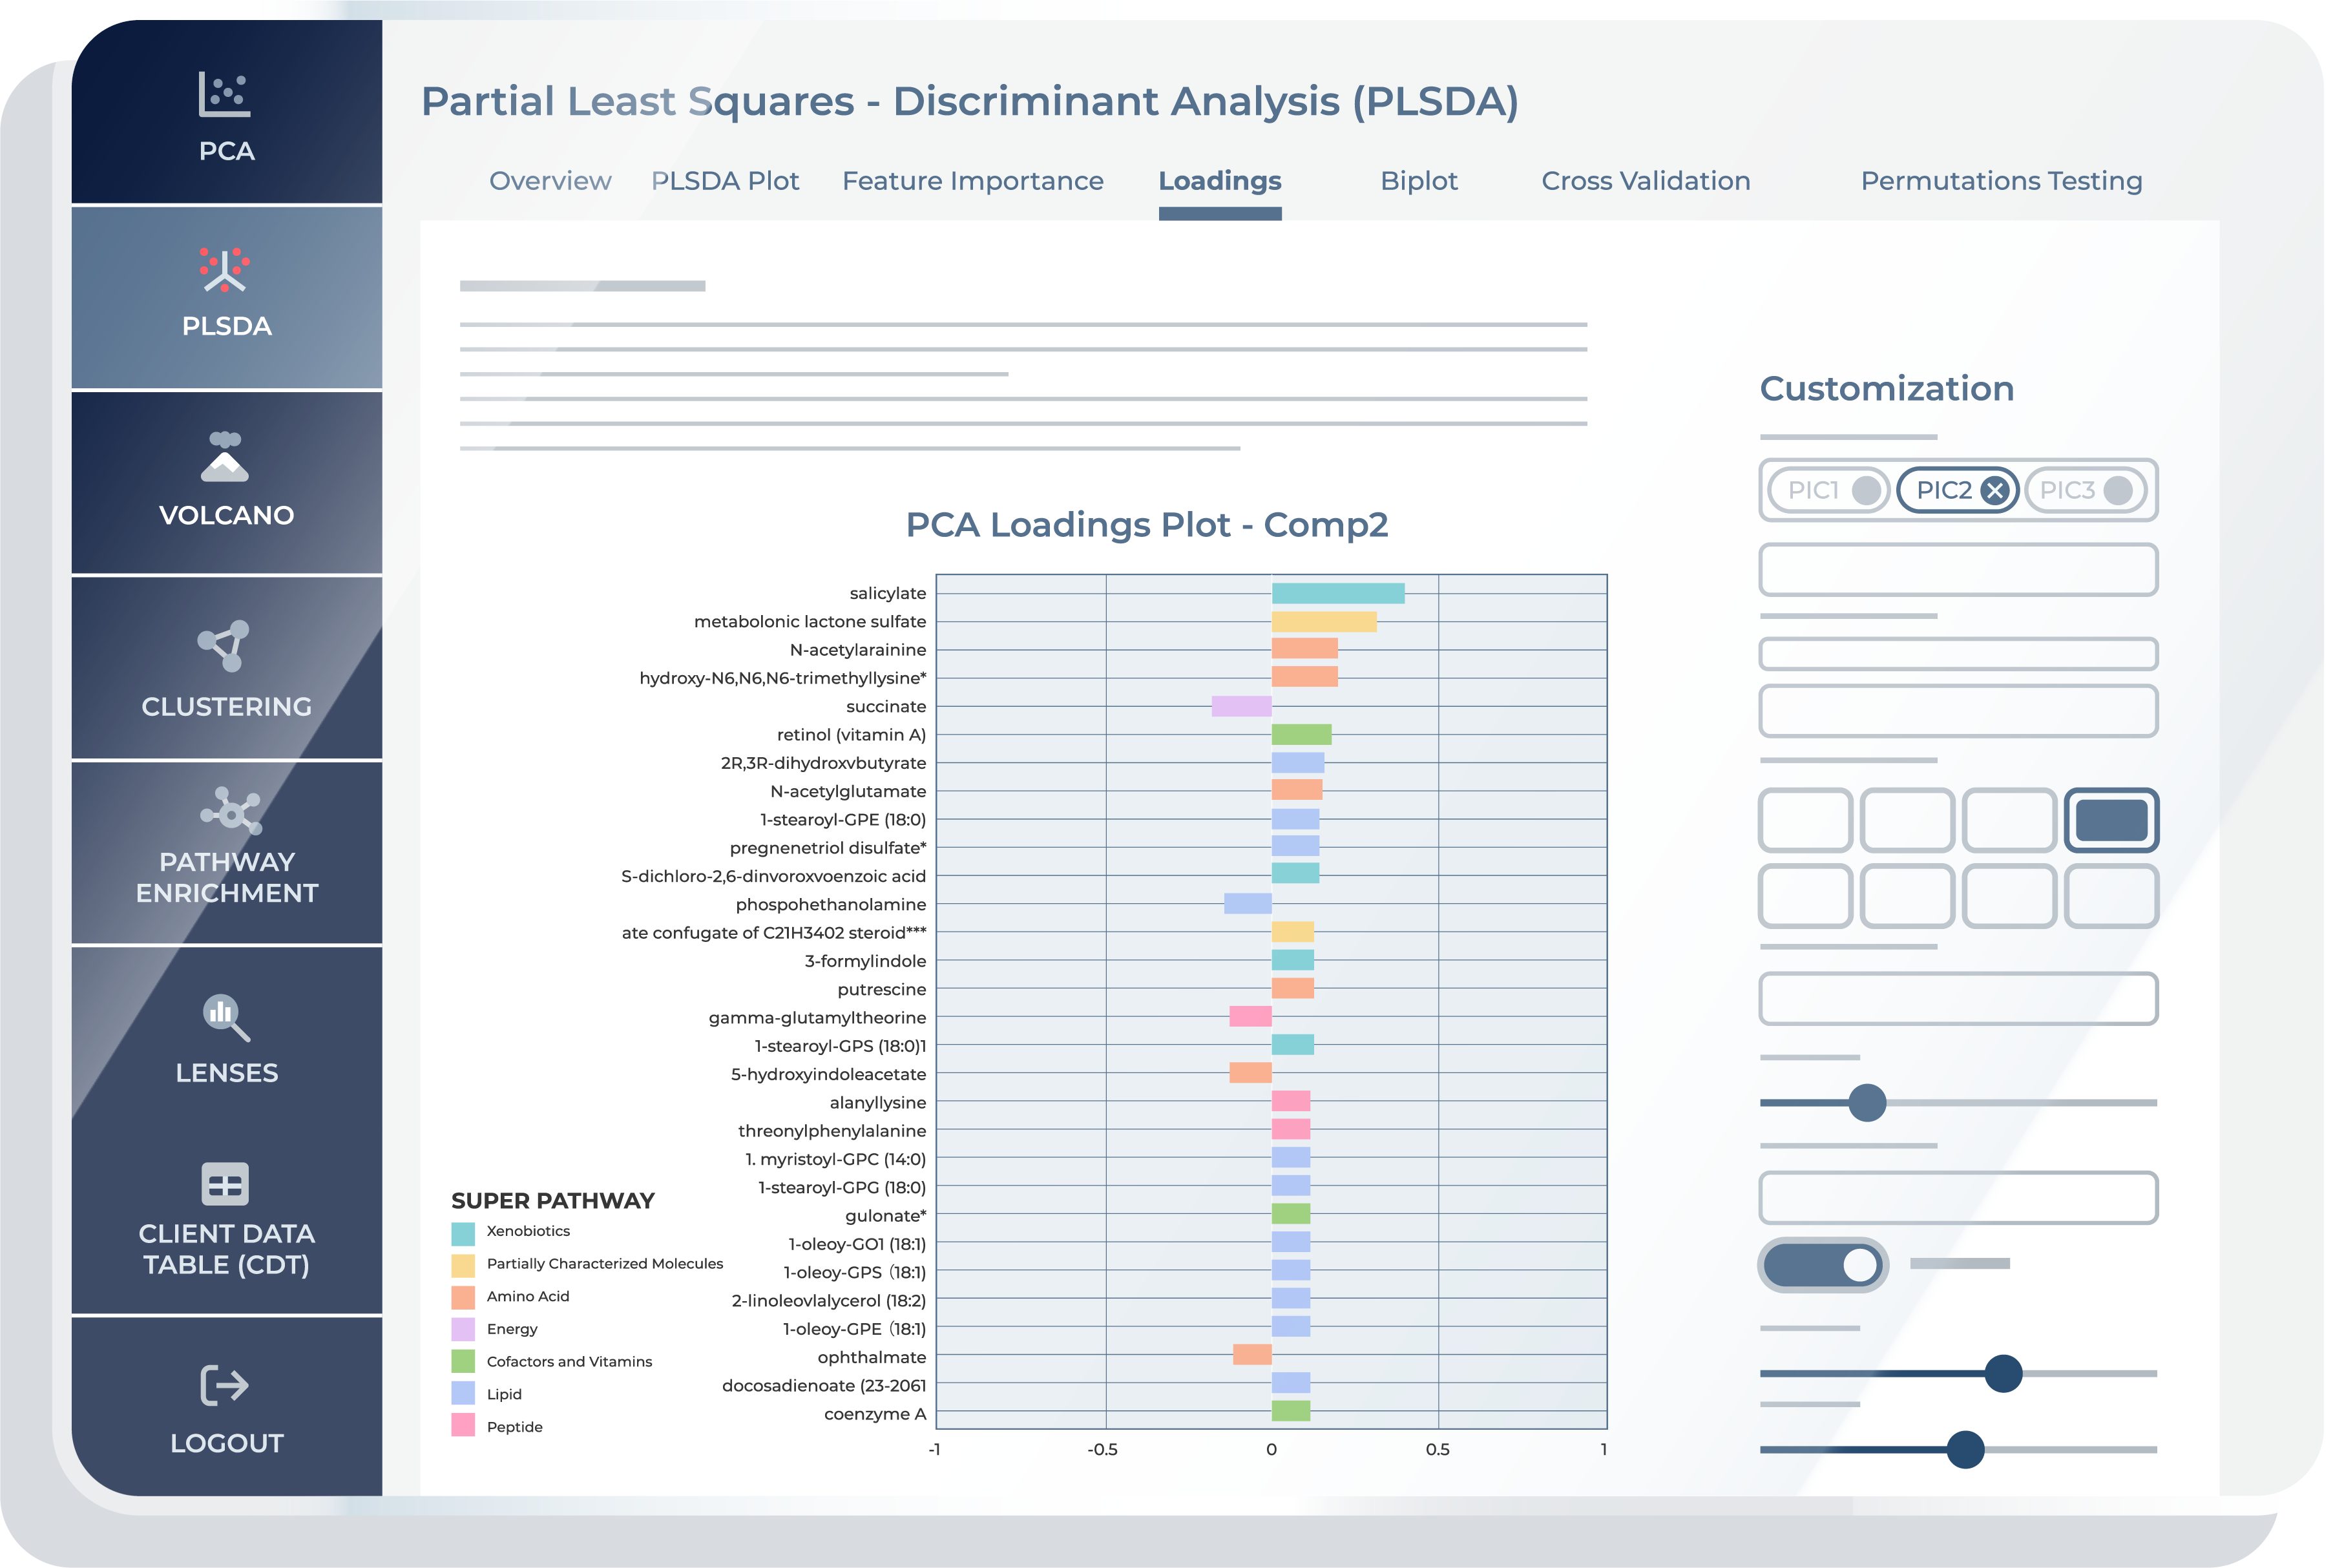
The “Loadings” feature in a PLS-DA provides you with a comprehensive view of how each metabolite contributes to the separation of different groups or conditions in your metabolomics data. While the term “loadings” is familiar from other multivariate techniques like PCA (Principal Component Analysis), it’s important to note that in the context of PLS-DA, “Loadings” take on a slightly different role. Here, they specifically highlight the metabolites that are most instrumental in achieving effective discrimination between groups.
The PLS-DA “Loadings” tab is instrumental for interpreting the impact of each metabolite on the discriminant components. This functionality is essential in metabolomics for identifying metabolites that contribute significantly to the model, offering insights into the metabolic profiles that distinguish between groups like diseased vs. healthy states. High loadings on a component signify a strong association with the group separation, providing a valuable resource for biomarker discovery and understanding the metabolic underpinnings of biological processes.
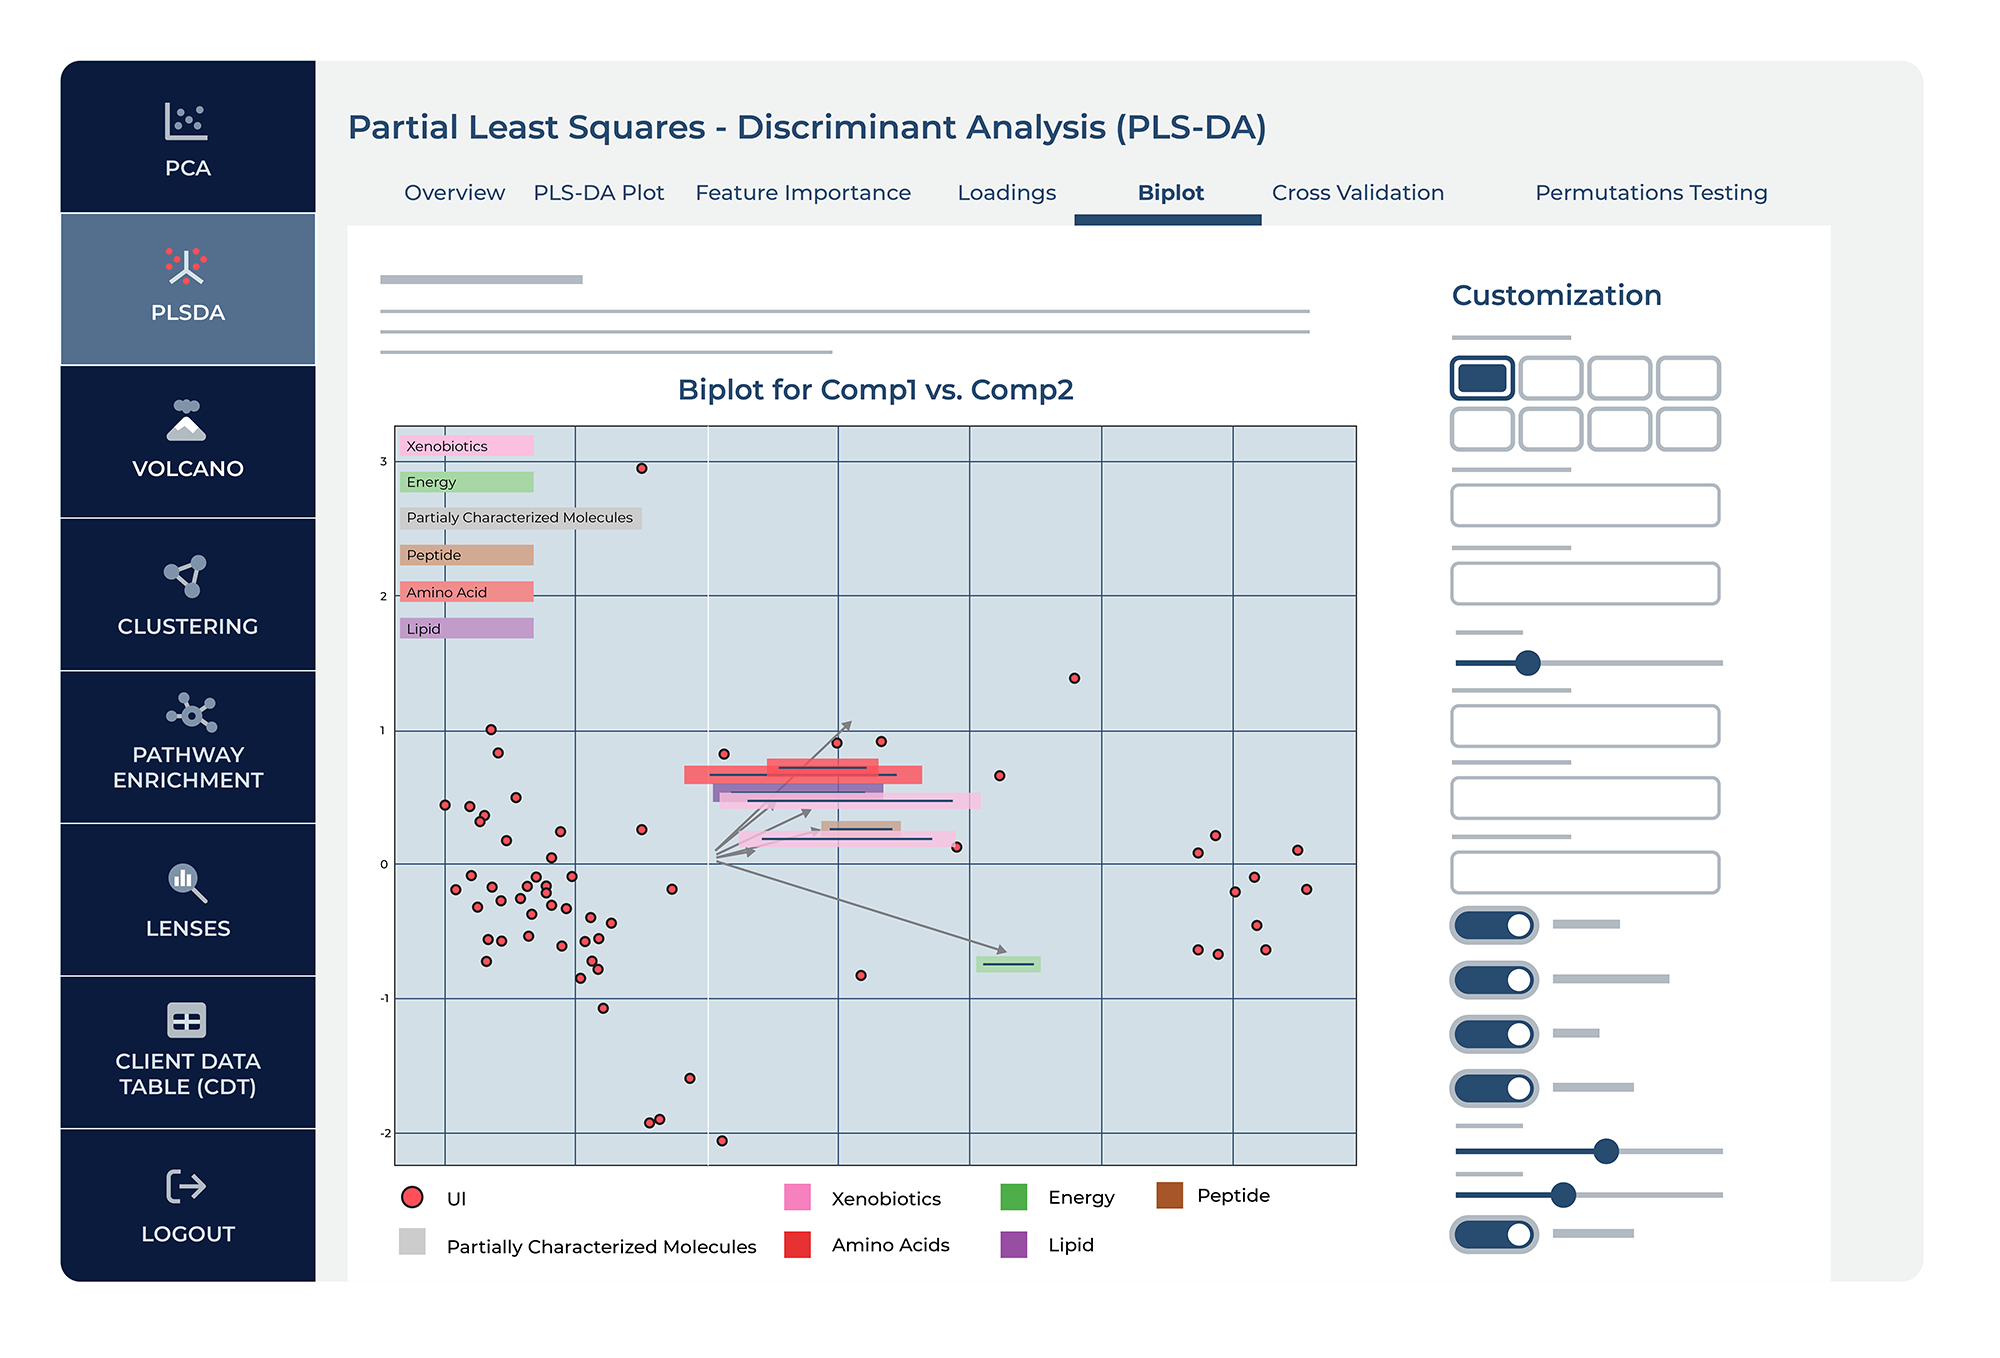
La función "Biplot" de PLS-DA fusiona dos visualizaciones críticas: las puntuaciones de las muestras en componentes latentes y las cargas de los metabolitos. Las muestras se representan como puntos, mientras que las influencias de los metabolitos se representan como vectores. La orientación y longitud de los vectores indican la correlación de los metabolitos con cada componente y su importancia relativa. Al mostrar cómo se relacionan los metabolitos con cada componente, los diagramas PLS-DA proporcionan información sobre la estructura de los datos, destacando los metabolitos más característicos de la separación de grupos.
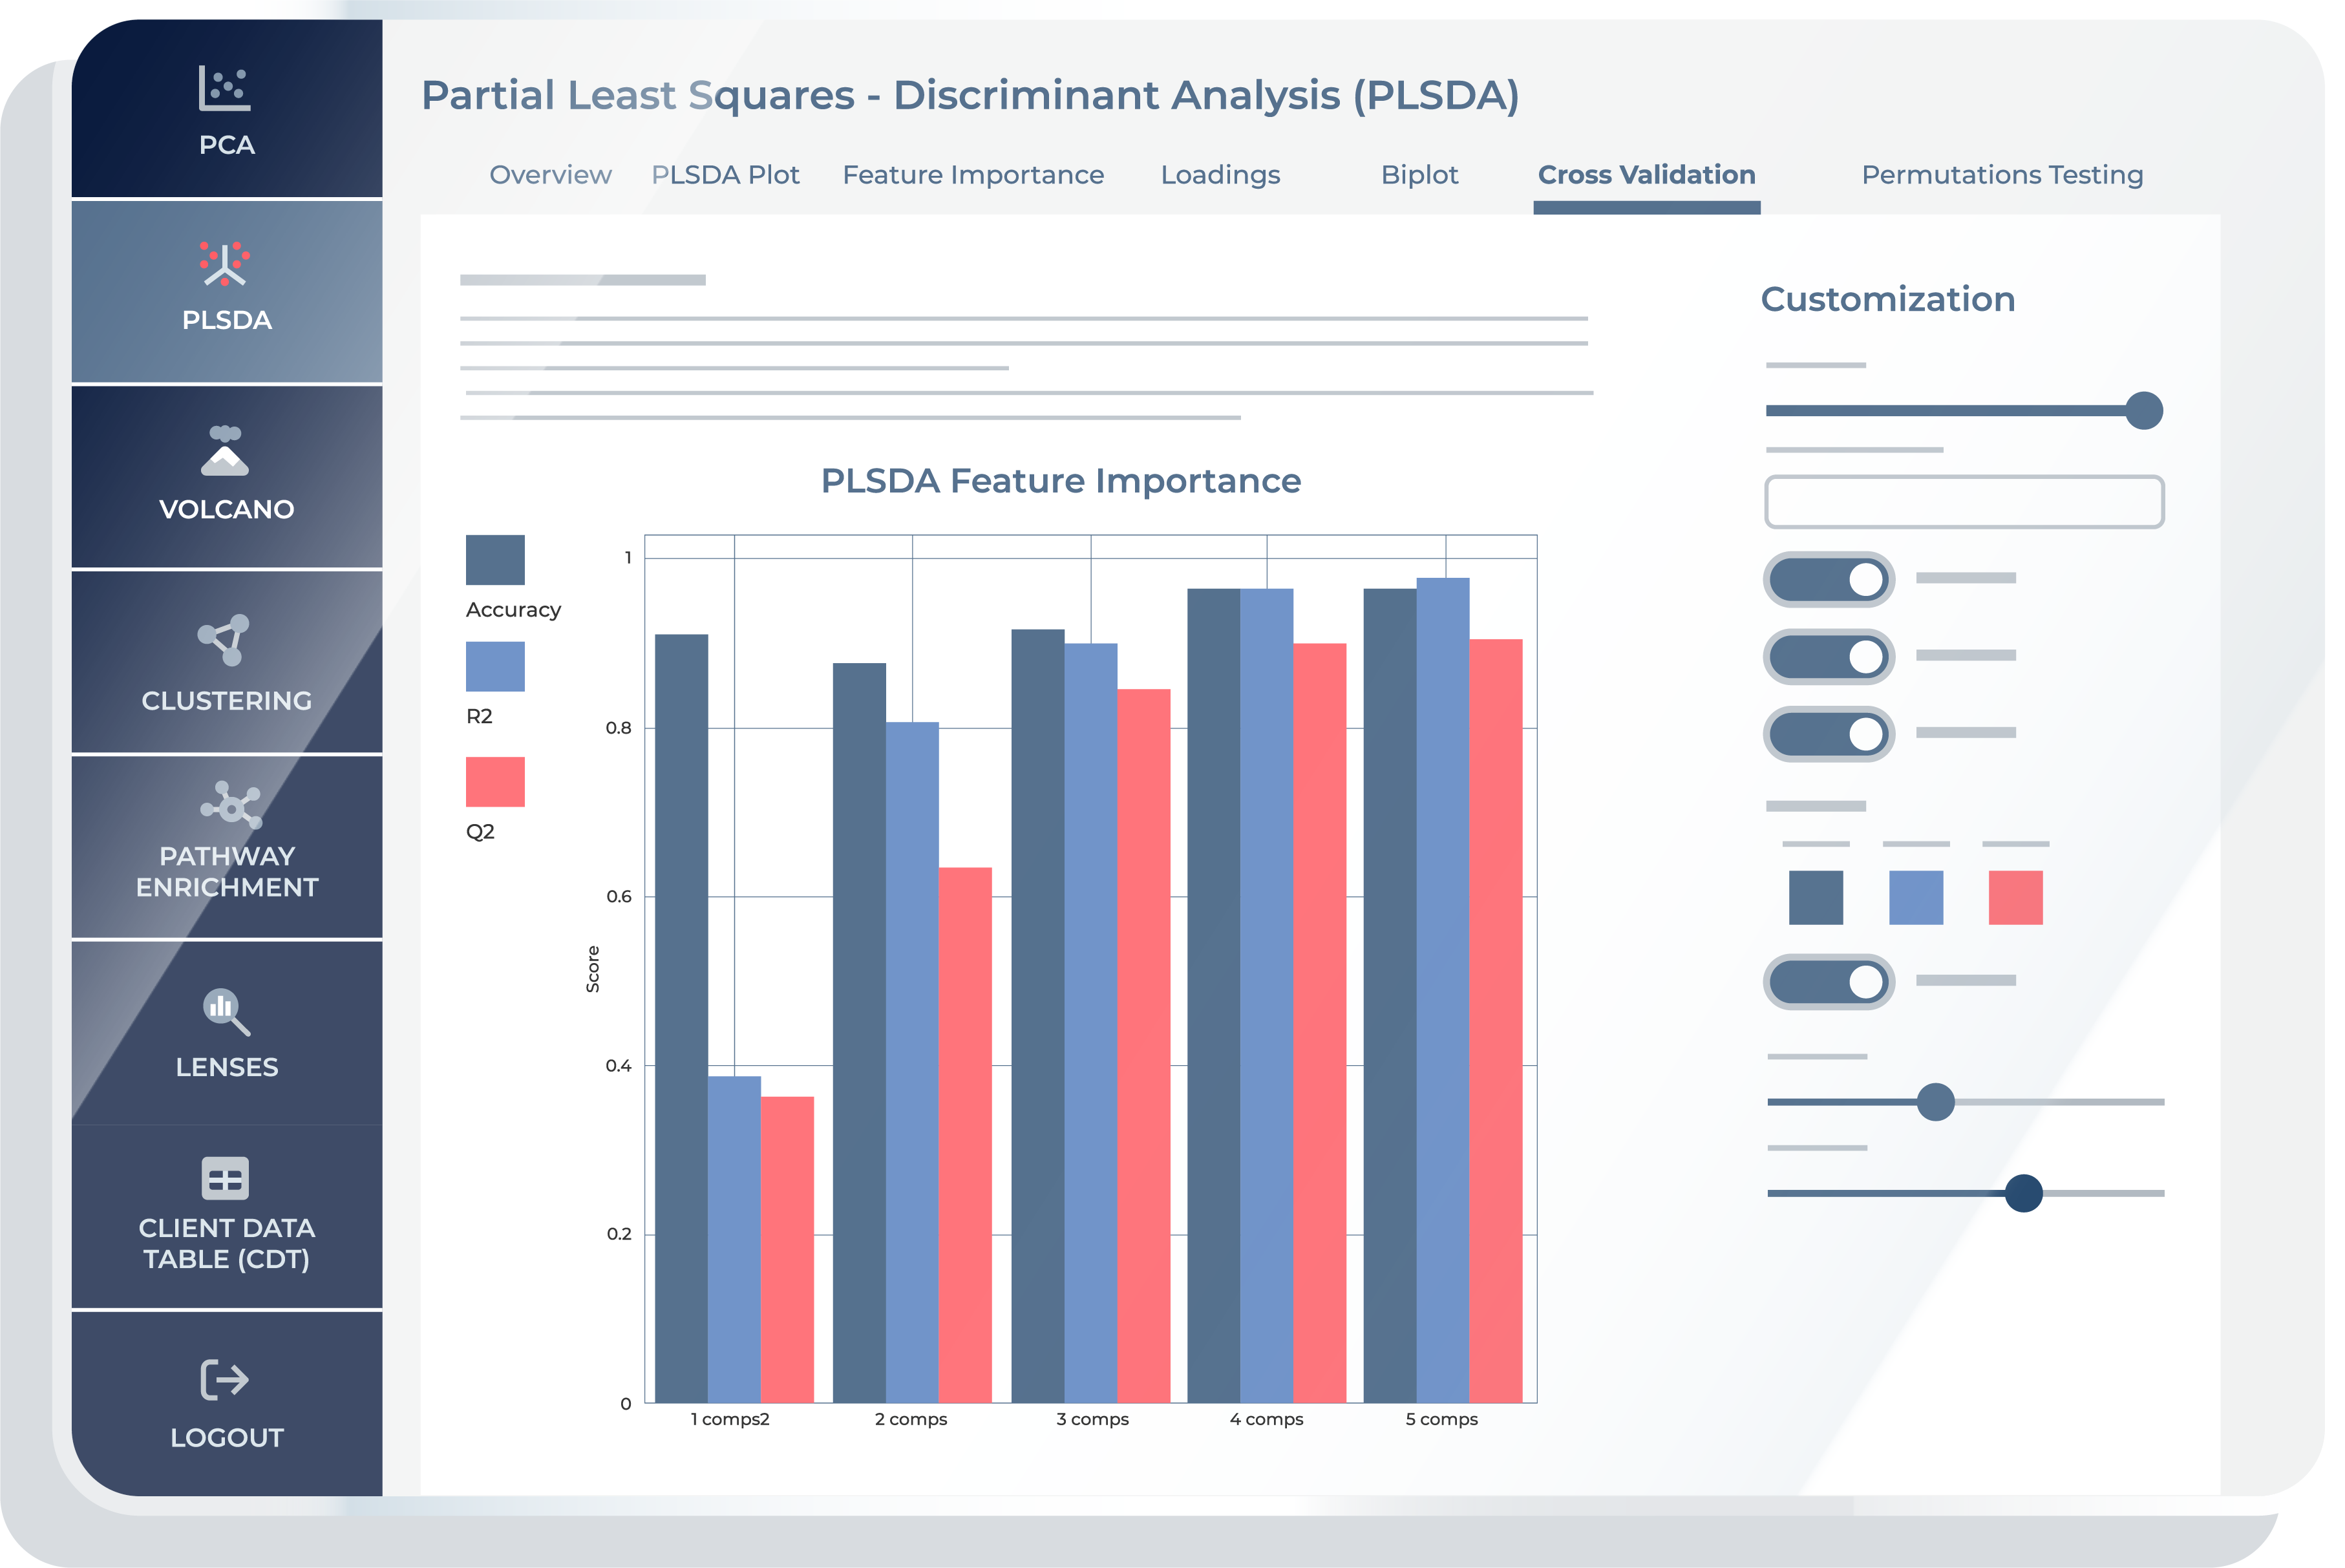
The “Cross Validation” feature provides you with critical insights into the performance and robustness of the PLS-DA model. Within this feature, you will encounter a set of interactive options that enable them to fine-tune and ensure that the model is not overfitting the data.
This feature is essential for researchers seeking to validate and fine-tune their PLS-DA model, offering valuable insights into its reliability, predictive power, and suitability for their specific research objectives. By partitioning the dataset and iteratively testing the model, cross-validation assesses how well the metabolites differentiate conditions, such as diseased versus healthy states. This process is key for validating the reliability of biomarkers identified by PLS-DA and ensures the derived metabolic insights generalize beyond the sample data.
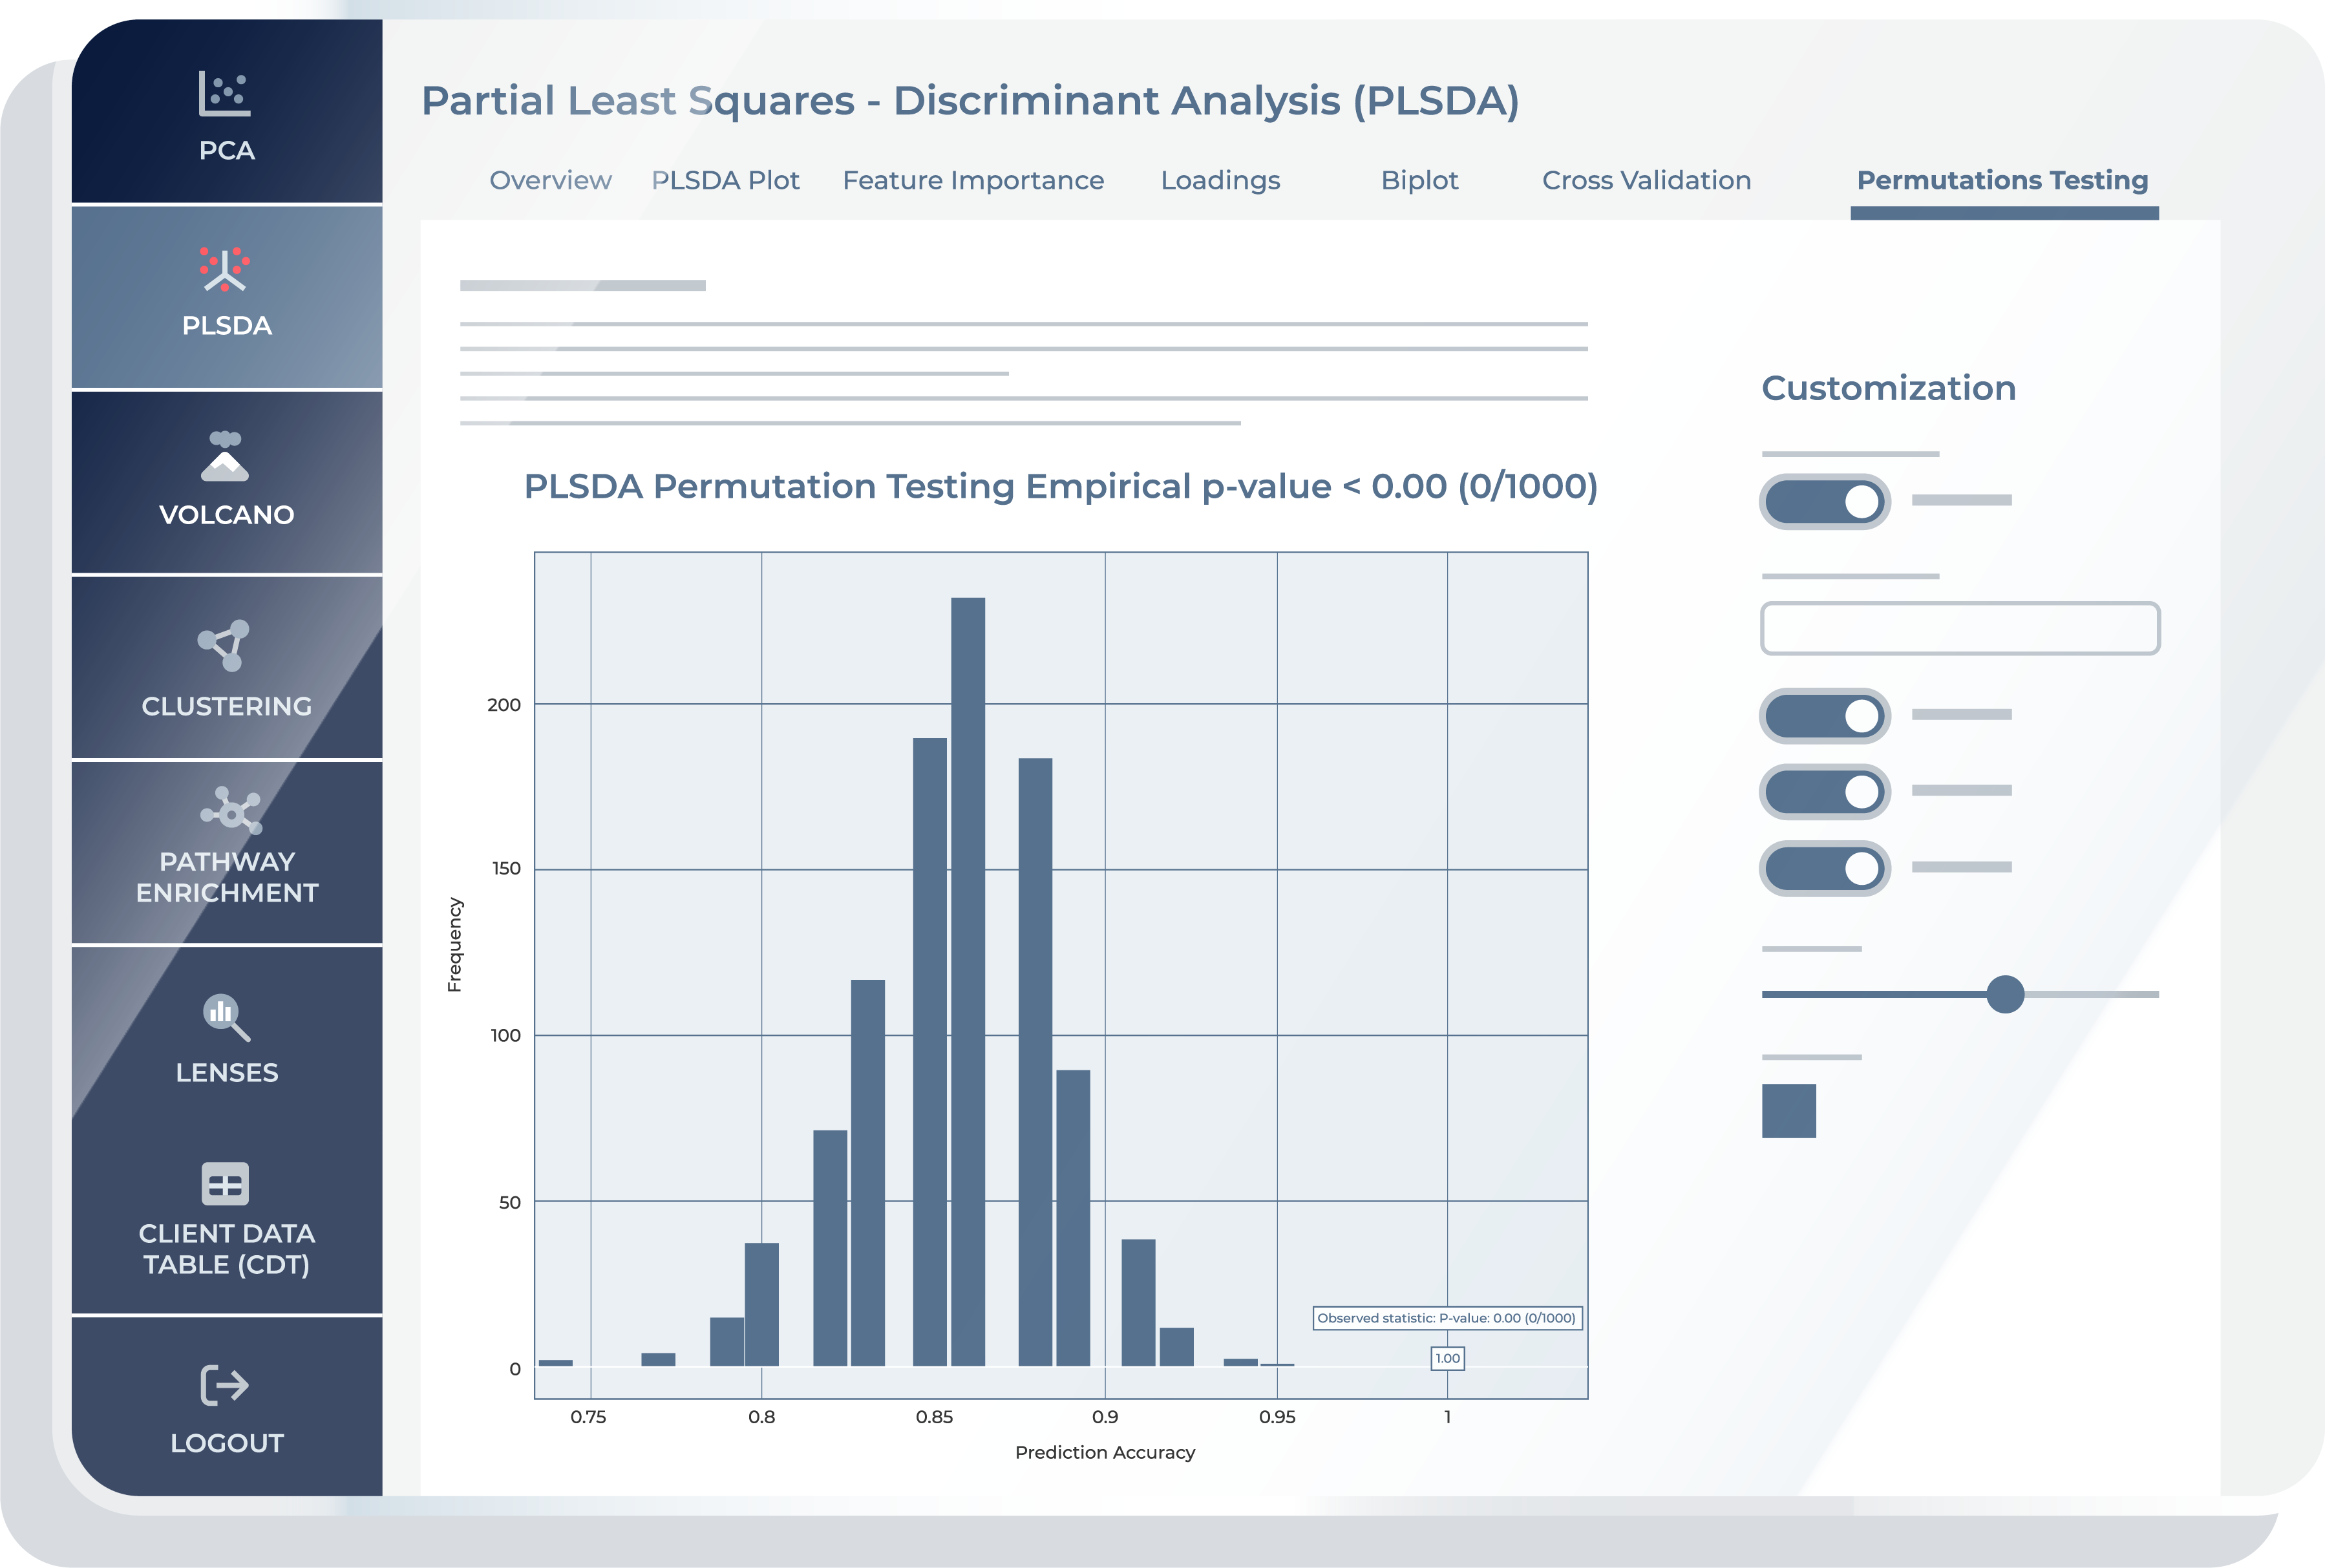
The “Permutation Testing” feature offers an evaluation of the classification model’s robustness and statistical significance. Permutation testing is a non-parametric approach used to assess the significance of a model’s results. In the context of PLS-DA, this test helps verify whether the observed classification accuracy is better than what would be expected by chance.
Building on Cross Validation, Permutation Testing takes the evaluation a step further by assessing the model’s performance under random conditions. The key objective is to determine whether the classification results observed in the Cross Validation feature are statistically meaningful or if they could have occurred by random chance.
Visión general de PLS-DA
PLS-DA desempeña un papel fundamental en el análisis metabolómico, ya que proporciona un potente marco estadístico para desentrañar relaciones complejas en conjuntos de datos de alta dimensionalidad. PLS-DA destaca en la reducción simultánea de la dimensionalidad y la clasificación, lo que permite a los investigadores discernir patrones asociados a diferentes condiciones experimentales o clases de muestras. Este método es especialmente útil para identificar biomarcadores, distinguir entre estados fisiológicos y predecir la pertenencia a una clase de nuevas muestras en función de sus perfiles de metabolitos.
PLS-DA es un método supervisado de reducción de la dimensionalidad que, a diferencia de PCA, incorpora etiquetas de clase en el análisis. Descubre variables latentes (componentes) que maximizan la separación entre diferentes grupos predefinidos (por ejemplo, sanos frente a enfermos) en los datos. Al proyectar los datos sobre estas variables latentes, PLS-DA captura la varianza y la estructura de correlación de los datos más relevantes para la diferenciación de grupos.
La principal ventaja de PLS-DA sobre PCA es su capacidad para centrarse en la separación de grupos y mejorarla. Mientras que PCA únicamente maximiza la varianza sin tener en cuenta las etiquetas de clase, PLS-DA utiliza estas etiquetas para encontrar la dirección de máxima separación de clases, lo que es más adecuado para tareas de clasificación. En metabolómica, esto significa que PLS-DA puede resaltar más eficazmente los metabolitos que diferencian entre condiciones tales como estados de enfermedad.
PLS-DA en la plataforma bioinformática integrada de Metabolon
Dada su naturaleza supervisada, PLS-DA requiere una cuidadosa parametrización y una comprensión de los datos subyacentes. La experiencia de Metabolonen la aplicación de métodos estadísticos asegura que los datos de entrada para PLS-DA se preparen adecuadamente, permitiendo un análisis robusto y significativo. En el contexto de la Plataforma Bioinformática de Metabolon, PLS-DA puede ayudarle a conseguir lo siguiente:
Exploratory Data Analysis
PLS-DA ayuda a identificar patrones relacionados con diferentes condiciones y puede ser útil para generar hipótesis.
Visualization and Pattern Recognition
La capacidad de PLS-DA para reducir las dimensiones de los datos preservando al mismo tiempo la información de discriminación de clases lo convierte en una potente herramienta para visualizar conjuntos de datos complejos. Ayuda a distinguir entre grupos, como la diferenciación entre estados sanos y enfermos basada en perfiles metabolómicos.
Feature Selection
PLS-DA es eficaz para filtrar el ruido y centrarse en los metabolitos más relevantes para distinguir entre grupos, ofreciendo una visión más clara de las características más impactantes de los datos.
Simplificar el análisis complejo y mejorar la generación de hipótesis
- Automated PLS-DA Computation
Our platform simplifies the PLS-DA process by precomputing analyses, removing the need for you to set intricate parameters. The platform computes various discriminant components, ready for immediate exploration and comparison. The data provided as input to the application is normalized and prepared ensuring accuracy and consistency in the analysis. You are also provided with the option to validate PLS-DA performance to avoid overfitting in cross-validation and permutation. - Customizable Visualizations
You can fully customize the visual aspects of your PLS-DA plots, from color themes to legend font sizes, allowing for personalized data representation. The tool offers interactive plots that enable you to zoom, pan, and select specific data points or groups, facilitating an in-depth examination of the data. Features such as group-specific coloring and symbolization in plots provide a tailored visual approach, aiding in the development of focused hypotheses. - Exportable Tables
You may export and download all data tables including the dataset and the calculated principal components.
