Chapter 3
Metabolomics for Commercial Applications
In this chapter, you'll learn how metabolomics can reveal functional insight into disease phenotypes that traditional biomarkers fail to provide, how it can identify high performing diagnostic biomarkers that are invisible to other omics sciences, and how it can inform human nutrition to mitigate disease and improve overall health.
Overview
Metabolomics has become an invaluable tool in various applied markets including drug development, human nutrition, animal husbandry, and pet care. Metabolic changes can elucidate novel therapeutic targets and mechanisms of drug action, identify connections between diet and disease phenotypes, and reveal biomarkers that inform animal health. Here, we discuss a few studies that show how metabolomics helped solve a problem and/or provided key scientific insight into topics related to selected applied markets.
Drug Development
Gaining Insight into Drug-Induced Toxicity that Traditional Biomarkers Failed to Provide
Background. Dyslipidemia, an abnormally high level of low- and very low-density lipoproteins (LDL/VLDL) in the blood, is a major risk factor for cardiovascular disease and stroke. Nicotinic acid receptor (NAR) agonists treat dyslipidemia by activating receptors on fat cells to inhibit triglyceride metabolism and reduce circulating levels of LDL and VLDL. In one study, investigators at Merck Research Laboratories were developing a NAR agonist (SCH 900424) to treat dyslipidemia, but in their investigations identified potential drug-induced toxicity which they wanted to better understand and monitor [1].
Preliminary Data and Study Goals. In preclinical studies SCH 900424 unexpectedly caused rapid morbidity and acute kidney injury (AKI) in mice, implying that the drug was affecting both the renal and central nervous systems (CNS). Traditional markers of kidney function including creatinine and BUN were not sensitive enough to either predict or characterize the drug-induced toxicity, and the underlying mechanism(s) were unknown. The goals of this study were to identify sensitive and early biomarkers of SCH 900424-related toxicities in mice and elucidate the mechanism(s) that led to toxicity.
Methods. Adult male CD-1 mice were dosed with low, medium, and high concentrations of SCH 900424 or a control agonist. Plasma, urine, and brain samples were collected 1, 4, 8, and 24 hours post dose. Samples were processed then analyzed using global metabolomics to identify perturbations in relevant biochemical pathways. Targeted metabolomics was then used to measure biochemicals of interest identified in the global discovery analyses. Three sample matrices were analyzed to ensure a comprehensive mechanistic study of both AKI- and CNS-related pathologies.
Results. In plasma, 3-indoxyl sulfate (3IS), a gut-derived uremic toxin produced from tryptophan metabolism, emerged as a top biomarker of SCH 900424-induced AKI. This marker increased significantly in treated mice relative to controls and also rose earlier and more drastically than creatinine or urea (Figure 5, High Dose), showing that 3IS is a more sensitive marker of AKI than traditional markers of kidney function.
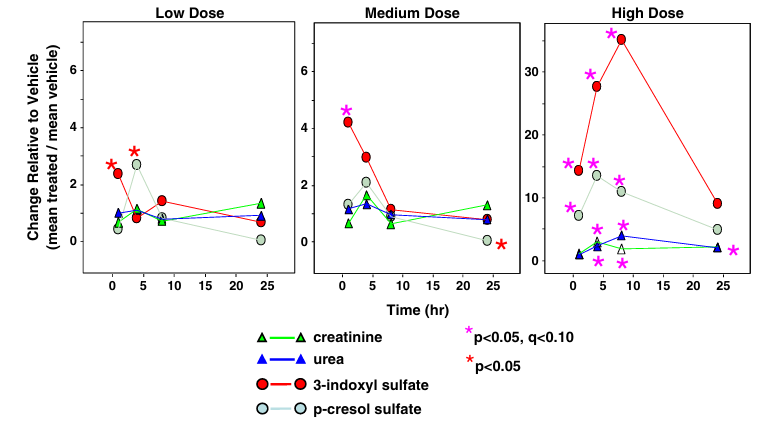
Figure 5. Fold-changes relative to vehicle in plasma for 3IS, PCS, urea, and creatinine following administration of SCH 900424. Based on the comprehensive global metabolomic analysis, 3IS and p-cresol sulfate were identified as the most statistically significant plasma markers of renal toxicity in this study and were more sensitive than urea and creatinine. Image reproduced from Zgoda-Pols et al., Toxicol Appl Pharmacol, 2011, licensed under CC BY 4.0.
Plasma levels of P-cresol sulfate, a uremic toxin produced from metabolism of tyrosine and phenylalanine, was also significantly elevated (Figure 5, High Dose). Several amino acids, including tryptophan, significantly decreased in plasma while many tryptophan catabolites including kynurenine, kynurenate, and indole-3-lactate were significantly increased (Figure 6). In urine, significant increases in glucose and amino acids were observed. Under normal conditions, nearly all filtered amino acids and sugars are reabsorbed in the proximal tubules. However, a kidney injury would impair reabsorption and cause them to be excreted into the urine. The metabolic signature observed across plasma and urine supported true renal dysfunction rather than isolated metabolic changes.
Another important study finding was the significant and dose-dependent elevation of 3IS in brain tissue after administration of SCH 900424. This increase occurred in tandem with significant reduction in urinary levels 3IS, indicating impaired clearance leading to its accumulation in the brain. Overall, these findings suggested that accumulated 3IS in plasma and brain may not only contribute to AKI, but also to CNS toxicity and rapid morbidity in mice.
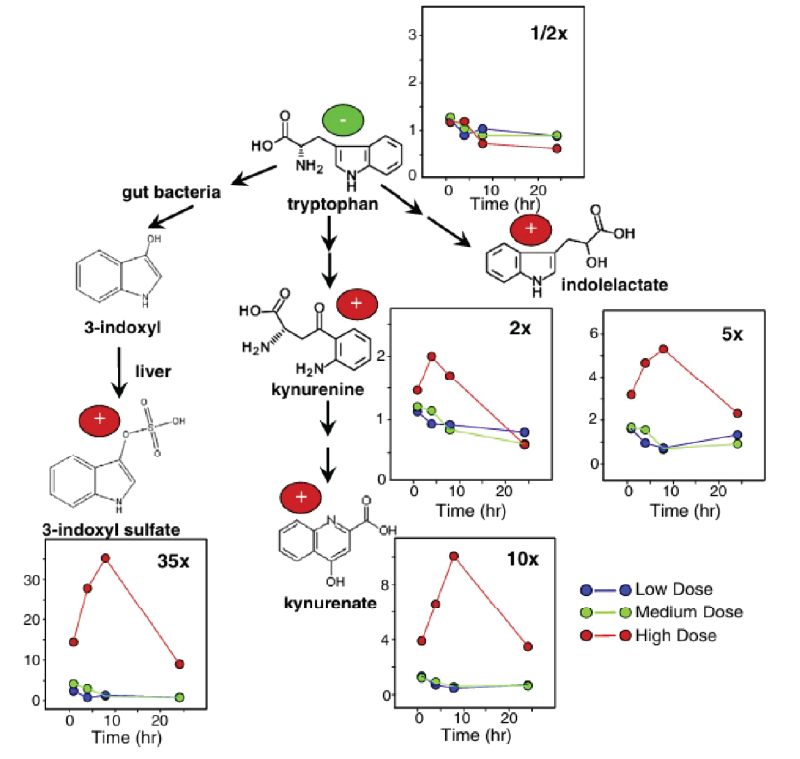
Figure 6. Catabolic pathways of tryptophan with fold-changes relative to vehicle for individual catabolites. While tryptophan decreased over time with the higher doses of SCH 900424, its catabolites, and especially 3IS, increased dramatically. Image reproduced from Zgoda-Pols et al., Toxicol Appl Pharmacol, 2011, licensed under CC BY 4.0.
Study Conclusions
- This study's findings suggest that 3IS is an early and more sensitive marker of SCH 900424-induced renal toxicity than traditional chemistry markers. In practice, this could improve early detection of nephrotoxicity in drug development.
- The observed accumulation of gut-derived uremic toxins, disrupted tryptophan metabolism, and patterns of reduced urinary excretion provided mechanistic evidence of uremic toxin buildup due to renal dysfunction.
- Accumulation of 3IS in brain tissue, rather than only plasma, suggests a mechanistic link between kidney failure and rapid morbidity in mice; a novel hypothesis that can be tested in future studies.
- This study shows how metabolomics can help turn an uncharacterized phenotypic observation into a mechanistically informed biomarker story to inform on drug candidate selection with greater speed and accuracy.
Rescuing a Drug Development Program
Background. C. difficile infection (CDI) causes inflammatory colitis and subsequent diarrhea that is quite debilitating to patients. Even with antibiotic treatment, 20-30% of patients have recurrent CDI due to continued disruption of their microbiome. In a healthy gut, gut bacteria suppress the growth and germination of C. difficile by converting conjugated primary bile acids to secondary bile acids and by producing short- and medium-chain fatty acids. Fecal microbiota spores produced by members of the Firmicutes phylum have been shown to recolonize the gut with bacteria that guard against recurrent CDI. In one study, investigators at Seres Therapeutics developed VOS (formerly SER-109), an orally administered microbiome-based live biotherapeutic product intended for treatment and prevention of recurrent CDI [2].
Preliminary Data and Study Goals. VOS engraftment was consistent among patients and only 13.3% of patients experienced CDI recurrence across a range of doses administered in an open-label phase 1 study. However, VOS did not meet its primary efficacy endpoint in a follow-up randomized, placebo-controlled phase 2 study, where it was administered at a fixed dose that had shown efficacy in phase 1. In response, this group performed several follow-up metabolomics studies. The goal of their first follow-up study was to reconcile these disparate results by evaluating VOS-induced changes to the microbiome and microbe-associated metabolites [3]. Their second goal is described in the next section titled ‘Success in a Phase 3 Trial Despite Failure in Phase 2’.
Methods. In the phase 1 and 2 clinical trials, VOS engraftment was assessed by comparing the number of VOS-associated bacterial species in stool samples 1, 4, and 8 weeks after dosing and CDI recurrence was determined based on clinical symptoms. Whole-metagenomics shotgun sequencing and global metabolomics analyses were conducted post-hoc on phase 1 and phase 2 datasets to evaluate the impact of VOS on clinical outcomes.
Results. In the phase 2 clinical trial, treated participants who did not develop recurrent CDI had significantly more VOS species one week after dosing than those who experienced a recurrence. A post-hoc analysis of the phase 1 and phase 2 trial results were performed to assess the magnitude of engraftment one week after participants received a high (phase 1), low (phase 1), or fixed (phase 2) dose. Phase 1 subjects who received the high dose had a significantly greater number of VOS species by week 1 than the other 2 dosing cohorts (Figure 7). Furthermore, week 1 engraftment was shown to be highly variable in phase 2 participants, suggesting that successful engraftment was dependent on dose and that dosing was suboptimal in the phase 2 trial.
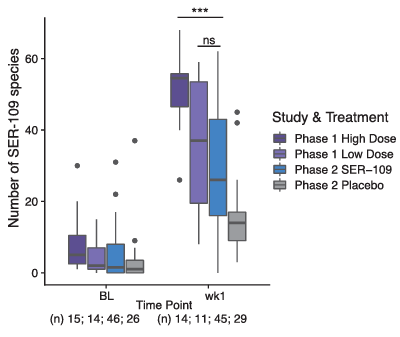
Figure 7. Relationship of engraftment of VOS species to doses administered in the phase 1 and 2 studies. Participants who received the high dose in the phase 1 study had significantly more VOS species than participants in the treatment arm of the phase 2 study who received a low fixed dose (p < 0.001). Image reproduced from McGovern et al., Clin Infect Dis, 2021, licensed under CC BY 4.0.
Interestingly, there was also a significant positive correlation between the number of VOS species and the abundance of the secondary bile acids, lithocholic acid (LCA) and deoxycholic acid (DCA), suggesting increased species engraftment leads to increased conversion of conjugated primary bile acids to secondary bile acids, a key step in suppressing growth of C. difficile and returning to normal gut health (Figure 8).
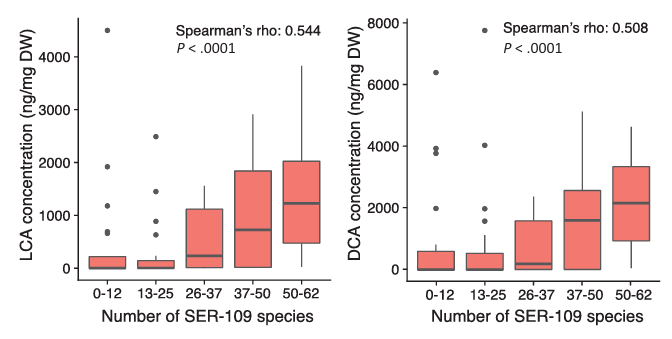
Figure 8. The relationship between the engraftment of VOS (formerly SER-109) species and concentration of secondary bile acids in the phase 2 study. The number of VOS species one week after dosing was significantly associated with the concentration of LCA and DCA. Abbreviations: DCA- deoxycholic acid, DW- dry weight, LCA- lithocholic acid. Image reproduced from McGovern et al., Clin Infect Dis, 2021, licensed under CC BY 4.0.
Study Conclusions
- This study showed that the phase 2 clinical trial was probably unsuccessful because of suboptimal dosing which led to inconsistent engraftment, rather than because of poor therapeutic efficacy.
- These findings also generated the hypothesis that VOS engraftment leads to important functional changes through key microbe-associated metabolites, which break the cycle of recurrent CDI.
- In this first follow-up study, metabolomics was instrumental in showing why results from the phase 1 and phase 2 studies disagreed with each other, which allowed the team to proceed with a redesigned phase 3 trial despite failure in phase 2, thus saving a promising therapeutic from being shelved and avoiding the loss of a commercial investment. The next case study discusses the outcome of this group's phase 3 trial.
A Successful Phase 3 Trial Despite Failure in Phase 2
Preliminary Data and Study Goals. In light of the results described in the above case study, investigators redesigned the phase 3 study to have a more efficacious dosing strategy [4]. Treatment arm participants were given a fixed dose of VOS that was 10-fold higher than the dose administered in phase 2 with the goal of testing the therapeutic efficacy of VOS under the proper conditions for engraftment.
Methods. Efficacy was evaluated based on the reduction of relative risk and sustained clinical response up to 8 weeks after dosing. Specifically, relative risk was defined as the percentage of patients with recurrence in the VOS group divided by the percentage in the placebo group. Sustained clinical response was defined as no recurrence through the 8 weeks that patients were followed. Global metabolomics analyses were conducted on stool samples collected 1, 2, and 8 weeks after dosing to evaluate bile acid profiles in the gut.
Results. VOS (formerly SER-109) was found to be superior to placebo in reducing the risk of CDI recurrence, and in generating a sustained clinical response in patients (Figure 9).
The VOS treatment group demonstrated significantly larger increases in secondary bile acids from baseline compared to placebo (Figure 10), which concurred with reduced amounts of proinflammatory Enterobacteriaceae bacteria and increases in Firmicutes bacteria, species that are thought to be key regulatory suppressors of CDI.
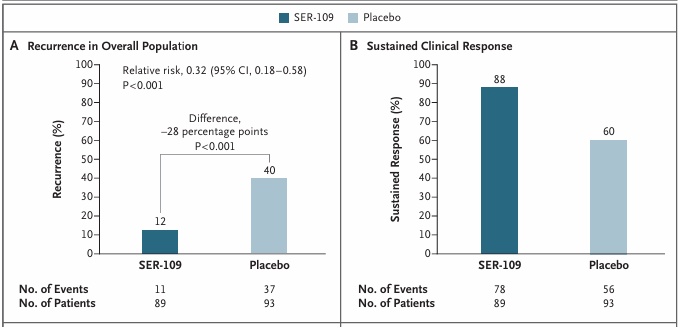
Figure 9. Recurrence of CDI up to 8 weeks. (A) primary efficacy analysis showed superiority of VOS (SER-109) compared to placebo in reduction of the risk of CDI recurrence. (B) VOS was also superior to placebo in generating a sustained clinical response. Image reproduced from Feuerstadt et al., N Engl J Med, 2022, licensed under CC BY 4.0.
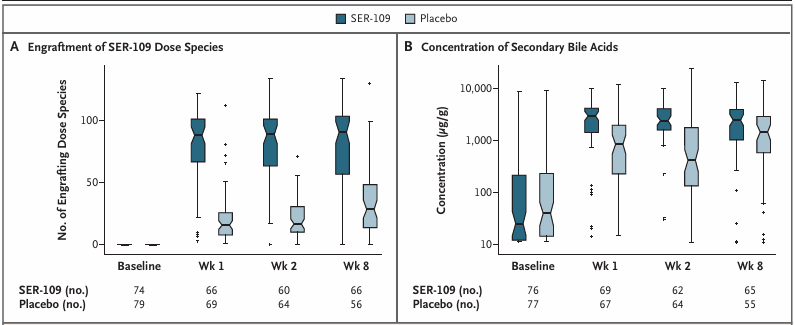
Figure 10. Compositional and metabolomic changes in the microbiome after receiving VOS (SER-109) or placebo. (A) The number of engrafting dose species and (B) the concentration of pooled secondary bile acids detected in patient stool specimens 1, 2, and 8 weeks after receipt of VOS or placebo. Image reproduced from Feuerstadt et al., N Engl J Med, 2022, licensed under CC BY 4.0.
Study Conclusions
- A phase 3 trial redesigned for optimal dosing based on metabolomics data enabled VOS to properly engraft and thereby demonstrate its superiority over placebo in preventing the recurrence of CDI.
- The metabolomics data from this and the previous clinical studies suggest that VOS engraftment is dose-dependent, and its mechanism of action may be linked to production of secondary bile acids.
- These findings led to a highly reasonable hypothesis about the mechanism of action of VOS. Since understanding the MOA of a therapeutic agent is essential for optimizing treatment efficiency, predicting side effects, and determining correct dosages, this study may facilitate cost-effective decision making for follow-up clinical studies
Discovering High-Performing Diagnostic Biomarkers Invisible to Other Omics Sciences
Introduction. Survival rates of colorectal cancer (CRC) could be improved by early detection and non-invasive biomarkers to facilitate this are a significant need. Changes in energy metabolism are a hallmark of tumorigenesis because cancer cells rely on aerobic glycolysis to generate energy and glycolytic intermediates, which serve as precursors for lipids and animo acids. Differences in plasma and serum amino acid and lipid profiles have demonstrated high sensitivity and specificity in distinguishing CRC patients from healthy controls.
Preliminary Data and Study Goals. A growing body of evidence suggests that platelets contribute to cancer progression. Co-culture experiments have shown that platelet rich plasma (PRP) fosters a proliferative phenotype in cancer cells, and platelet adhesion is thought to facilitate tumor metastasis. In this study investigators theorized that PRP with high biological activity may reveal metabolic changes that could aid in early detection of CRC. The goal of this study was to analyze the metabolic profiles of platelet rich plasma (PRP) in patients with CRC and healthy controls to identify metabolic changes that could help detect early-stage CRC [5].
Methods. Global metabolomics analysis was performed on PRP collected and grouped into individuals with Stage I and II CRC, Stage III and IV CRC, and healthy controls. Cluster analysis and class enrichment were used to evaluate the differences in profiles between the three cohorts.
Results. Lactose, glycerol-3-phosphate, 2-hydroxyglutaric acid, isocitric acid, and citric acid were significantly elevated in PRP collected from CRC patients compared to controls (Figure 11). Although the levels of these metabolites were not significantly different between early- (Stage I and II) and late- (Stage III and IV) stage malignancies, their consistently higher concentrations relative to controls did not preclude them as biomarker candidates for early detection of CRC.
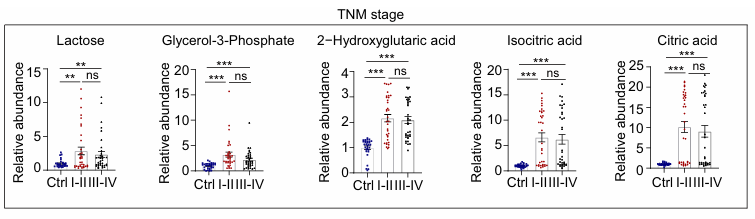
Figure 11. The relative abundance of five key carbohydrate metabolites in different stages of CRC progression. These metabolites were significantly different between CRC patients and controls. No difference between early- (Stage I and II) and late-stage (Stage III and IV) malignancies was observed. Image reproduced from Hu et al., Mol Oncol, 2025, licensed under CC BY 4.0.
The diagnostic performance of this 5-metabolite signature was compared to that of carcinoembryonic antigen (CEA) and carbohydrate antigen 19-9 (CA 19-9), two classic blood-based biomarkers of CRC. CEA demonstrated 80% sensitivity, 76.67% specificity, and an area under the receiver operating characteristic curve (AUC) value of 0.783; CA 19-9 achieved 74% sensitivity, 63% specificity, and an AUC of 0.641. By contrast, the metabolomics signature performed much better, distinguishing CRC from healthy controls with 90% sensitivity, 96.67% specificity, and an AUC of 0.961. (Figure 12).
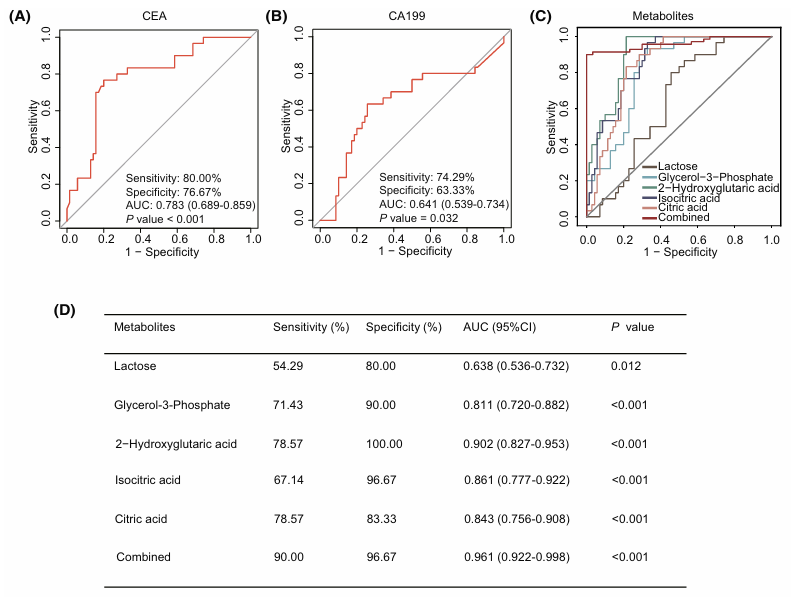
Figure 12. Diagnostic performance of the metabolic signature versus traditional biomarkers of CRC. (A) Diagnostic efficacy of CEA (B) CA 19-9, and (C) each signature metabolite alone and in combination. (D) The sensitivity, specificity, and AUC of each signature metabolite in distinguishing CRC patients from healthy controls. Image reproduced from Hu et al., Mol Oncol, 2025, licensed under CC BY 4.0.
Human Nutrition
Identifying Mechanistic Links Between Diet and Chronic Kidney Disease
Introduction. Chronic kidney disease (CKD) affects 800 million people worldwide and incurs an annual cost of approximately $407 billion. Diet significantly impacts kidney health, and based on recent findings, plant-based dietary patterns may offer a cost-effective way to prevent CKD. The Adventist Health Study-2 (AHS-2) is a multi-year study intended to measure connections between lifestyle, diet, and disease. Recent findings from this cohort showed an association between vegetarian dietary patterns and lower incidence of diabetes and hypertension, two key risk factors for CKD. The vegetarian diet was also strongly associated with reduced mortality from renal disease. Despite these strong associations, it was not clear how vegetarian dietary patterns seemed to protect kidney health.
Preliminary Data and Study Goals. Previous metabolomics analyses in the ASH-2 cohort showed that vegans had higher plasma levels of polyphenol-derived, microbial, and vitamin-related metabolites while nonvegetarians had higher levels of proinflammatory lipids and amino acids. With the goal of better understanding the potential cause and effect relationships between CKD risk, progression, and diet this study examined associations between vegetarian dietary patterns, kidney function, and diet-related metabolites using estimated glomerular filtration rate (eGFR) as a measure of kidney health [6].
Methods. 899 participants from the AHS-2 cohort were grouped according to dietary patterns which included vegan, pesco-vegetarian, and non-vegetarian. Global metabolomics was performed on serum samples collected from these study participants. Serum creatinine levels were used to calculate eGFR. For analyses of metabolite subclasses, individual component metabolite values within a subclass were averaged to obtain a composite mean for that subclass. T-scores were obtained by dividing the standard deviation of the composite means, accounting for the covariances between the metabolites. The number of significant or differential metabolites for each subclass was determined, along with the number of differential metabolites positively or inversely associated with the dietary pattern.
Results. Many metabolites were uniquely associated with diet and creatinine levels, which revealed specific connections between dietary patterns and metabolic phenotype. For example, relative to non-vegetarians, vegans had significantly lower levels of certain uremic toxins including p-cresol, 3-methyl catechol sulfate, and glucuronide, which are associated with lower eGFR and subsequently lower kidney function. Further analyses identified differential metabolite subclasses (rather than individual metabolites) associated with different dietary patterns and serum creatinine. Comparisons between vegan with non-vegetarian dietary patterns showed that plasmalogens and lysoplasmalogens had the largest proportion of significant metabolites in one or both groups (Figure 13). Plasmalogens and lysoplasmalogens have been shown to mediate membrane repair during oxidative stress. Reduced circulating levels of these metabolite subclasses have been observed in patients with advanced CKD, likely due to high oxidative stress.
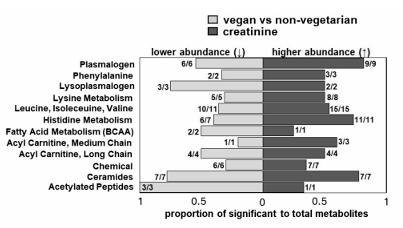
Figure 13. Differential subclasses showing opposite associations of dietary patterns and serum creatinine with plasma metabolites. Differentially abundant subclasses were determined after calculating the composite mean (averaging component metabolites) for each dietary group and subsequently t-scores. Bars reflect the proportion of differential metabolites to total metabolites on panel associated positively with creatinine (right of 0) or inversely with the indicated dietary pattern (left of 0). Ratios represent the number of significant metabolites associated in the same direction (inversely or positively) out of the total number of significant metabolites in the subclass. The predominant direction of change in abundance for each subclass, reflecting the overall direction of component metabolites, is plotted for contrasts of creatinine with vegan vs. non-vegetarian. Image reproduced from Butler et al., J Ren Nutr, 2025, licensed under CC BY 4.0.
Study Conclusions
- This study identified metabolic changes that were unique to different dietary patterns, to reveal mechanistic links between diets and eGFR.
- Metabolomics enabled investigators to look beyond the standard creatinine measurement to see underlying metabolic changes, providing more robust evidence that diet-driven metabolic pathways are directly linked to kidney health.
Addressing Limitations of Dietary Self-Reporting by Standardizing Biomarker Fingerprints of Food Intake
Introduction. Traditional methods of dietary assessment, which often rely on self-reporting, are prone to error and bias. Metabolomics can address this limitation by capturing food-derived compounds to provide an objective molecular fingerprint of food intake. Although many dietary biomarkers have been identified, most studies have focused on individual foods rather than whole dietary patterns, and few controlled feeding trials included a randomized cross-over approach to reduce heterogeneity when quantifying associations with specific diets.
Preliminary Data and Study Goals. To address the gaps in modern day dietary metabolomic reporting, this study conducted a randomized cross-over controlled feeding trial comparing a healthy Australian diet (HAD), which was based on current Australian Dietary Guidelines, to a typical Australian diet (TAD). The investigators’ goals were to 1) describe metabolic changes in plasma and urine in response to these two dietary patterns, and 2) identify discriminatory metabolites specific to the healthy diet in order to develop a metabolome-derived diet quality score that could help evaluate the association of the healthy diet with markers of cardiometabolic health [7].
Methods. In an 8-week randomized cross-over feeding trial healthy adults completed two controlled 2-week diet interventions, healthy diet and typical diet, separated by a washout period. All meals were provided to ensure adherence and minimize diet variability. Fasting blood and urine samples were collected before and after each intervention then analyzed using untargeted metabolomics profiling. Elastic net regression was used to identify metabolites that best distinguished the healthy diet from the typical diet. These metabolites were used to build a composite metabolome-derived diet quality score, which was then tested for associations with cardiometabolic markers including blood pressure, lipids, and fasting glucose.
Results. After two weeks, 408 plasma and 319 urinary metabolites differed from baseline, many of which belonged to lipid, amino acid, and xenobiotic pathways. Direct comparison of the two diets identified hundreds of metabolites that differed significantly. 43 of them showed consistent changes across plasma and urine, suggesting that each dietary pattern produced a robust metabolic signature (Figure 14). Machine-learning analysis identified 31 plasma and 34 urine metabolites that best distinguished the healthy diet (HAD) from the typical diet (TAD). These metabolites were used to create the metabolome-derived diet quality score (Figure 15 A, B). Higher scores, which indicated close adherence to the HAD, were significantly associated with improved cardiometabolic markers including lower blood pressure, triglycerides, LDL-cholesterol, and fasting plasma glucose (Figure 15 C-H).
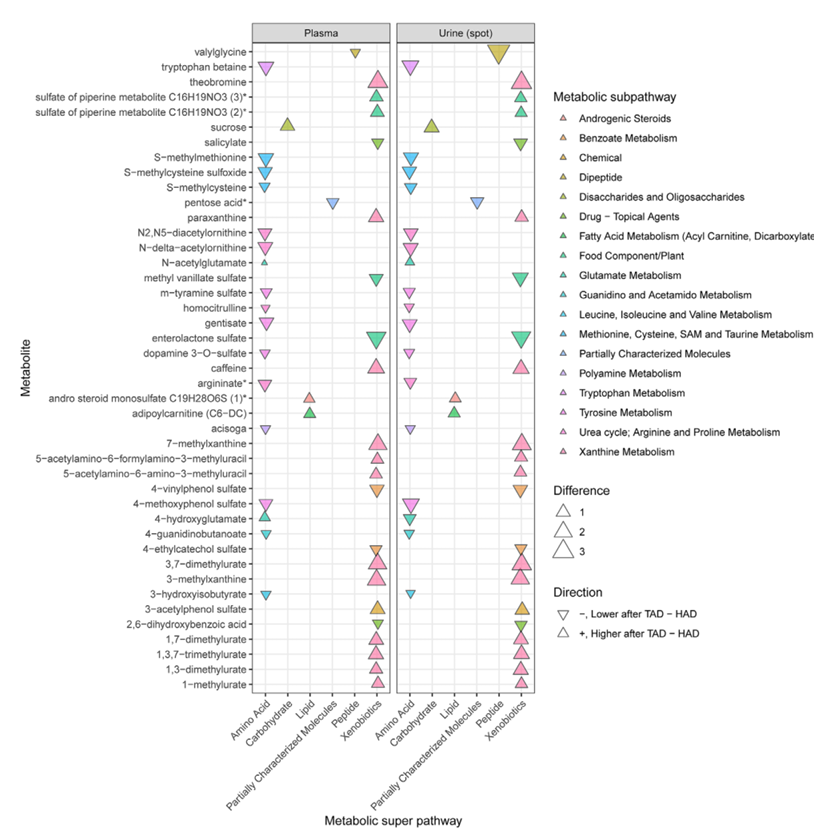
Figure 14. Magnitude and direction of change in 43 metabolites after two weeks of consuming a HAD compared to a TAD. Concentrations of these metabolites differed consistently between groups in both plasma and urine. Image reproduced from Stanford et al., Mol Nutr Food Res, 2025, licensed under CC BY 4.0.
Figure 15. Development of a metabolome-derived diet quality biomarker score and its association with markers of cardiometabolic health. Discriminative metabolites and their coefficients from (A) plasma and (B) urine are shown. The coefficients were used to construct a composite diet quality score, where a higher score was associated with significantly improved cardiometabolic outcomes including (C) lower systolic blood pressure, (D) diastolic blood pressure, (E) triglycerides, (F) LDL-cholesterol, (G) HDL-cholesterol, and (H) fasting glucose plasma. Image reproduced from Stanford et al., Mol Nutr Food Res, 2025, licensed under CC BY 4.0.
Study Conclusions
- In this study, investigators used metabolomics to derive a score that quantitatively measures diet adherence, which addresses bias and error inherent to self-reported dietary intake. Going forward, this diet quality score could significantly improve interpretability and reproducibility of nutrition-based studies to subsequently improve efficiency and cost-effectiveness of future study designs.
Developing Tools to Improve Measurability of Ultra Processed Food Intake
Introduction. Ultra processed foods (UPFs) are characterized by industrial ingredients and additives not typically used in home cooking including artificial sweeteners and modified starches. Although food processing plays an important role in food safety and shelf life, observational studies have consistently associated high consumption of UPFs with increased risk of obesity, cardiovascular disease, cancer, and all-cause mortality. Currently, nutritional studies involving UPFs are limited by a lack of tools to accurately measure UPF intake. Common dietary assessment questionnaires and 24-hour recall lack the detailed ingredient and processing information needed to classify foods according to industry classification systems.
Preliminary Data and Study Goals. The goal of this study was to address the need for objective biomarkers that can reliably capture UPF intake and its metabolic effects, with the long-term goal of improving the study of diet-disease relationships [8].
Methods. Controlled feeding trials, in which all foods are provided and intake is closely monitored, are ideal for identifying relevant biomarkers of UPFs. This study was a secondary analysis of a randomized, crossover, controlled-feeding trial in which 20 adults consumed either a diet high in UPFs or a diet entirely devoid of UPFs. Diets were matched for calories and nutrients. Blood and urine samples were collected at multiple timepoints throughout the study then analyzed by global metabolomics profiling. Metabolite levels were compared between diets using linear mixed-effects models, and additional analyses evaluated pathway level changes.
Results. Relative to the control diet, the high UPF diet induced widespread and consistent metabolic changes. As expected, several metabolites directly linked to food additives and preservatives were significantly increased in the high UPF diet while metabolites associated with whole fruits and vegetables were reduced, reflecting lower intake of these foods. Changes were also observed in pathways related to lipid metabolism, bile acids, amino acids, and gut microbial metabolites, showing that UPF consumption alters both host and microbiome-related metabolism. Importantly, many of these metabolite changes were consistent across plasma and urine, supporting their potential as robust candidate biomarkers of UPF intake and short-term metabolic response (Figure 16).
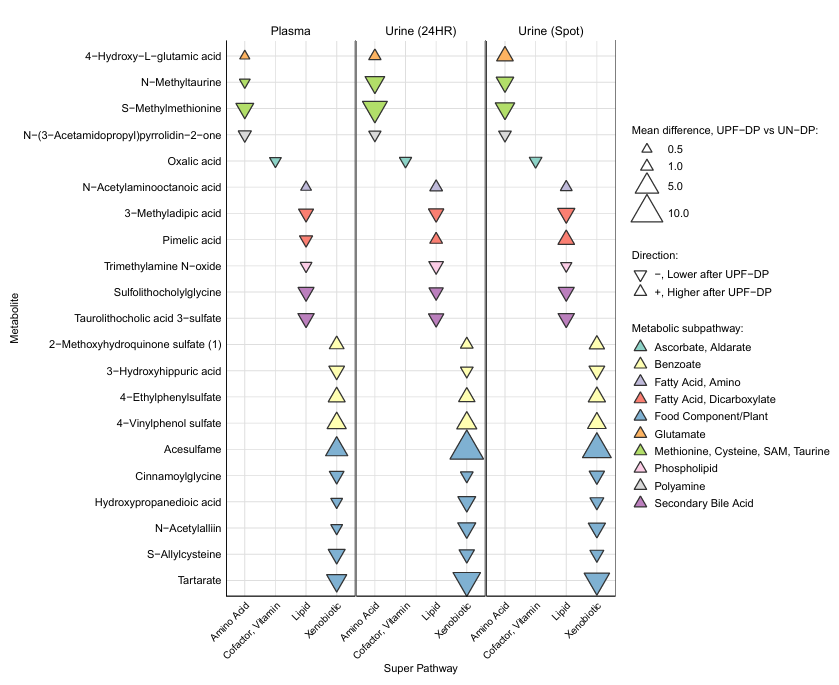
Figure 16. Magnitude and direction of mean differences at week 2 in metabolites after consumption of a high UPF diet compared with a control diet. Metabolites listed (n = 21) here differed within individual participants (n= 20) between UPF-DP and UN-DP at week 2 for plasma as well as week 1 and week 2 for 24-h urine. Mean differences in metabolites were estimated via a linear mixed model adjusted for diet, phase, sequence, and time point for urine only and calculated EI during the week prior to sample collection with subject-specific random intercepts. Image reproduced from O'Connor et al., J Nutr, 2023, licensed under CC BY 4.0.
Study Conclusions
- This study shows that consuming a diet high in UPFs results in clear and measurable changes in the plasma and urine metabolome. Metabolites directly linked to UPFs including benzoate preservatives and artificial sweeteners, as well as those associated with shifts in the microbiome, could serve as objective biomarkers of UPF intake.
- These biomarkers could help address some longstanding limitations of traditional dietary assessment methods and improve the accuracy and reproducibility of studies aimed at characterizing the relationship between diet and health.
Pet Health and Animal Husbandry
Characterizing the Mechanism of Action of a Widely Used but Poorly Understood Therapy for Chronic Large-Bowel Diarrhea in Dogs
Introduction. Chronic large-bowel diarrhea in dogs is a common gastrointestinal disorder driven by complex interactions between the gut microbiome, diet, host metabolism, immune responses, and environmental factors. Recent evidence suggests that microbial dysbiosis contributes to this condition by altering metabolic outputs in the gut, including the production of inflammatory or harmful metabolites. Supplementing the diet with fiber may improve gastrointestinal health by supporting beneficial microbial fermentation and increasing the production of protective postbiotics including short-chain fatty acids (SCFAs), secondary bile acids, and indoles. Although nutritional intervention is considered the primary therapy for chronic large-bowel diarrhea in dogs, the mechanisms behind its therapeutic effect are poorly understood.
Preliminary Data and Study Goals. Investigators at Hill’s Pet Nutrition, Inc., showed that a proprietary blend of soluble and insoluble fibers chosen for their pre- and postbiotic activity improved stool scores. The goal of this follow-up study was to evaluate the mechanistic impact of fiber-supplemented dietary intervention on GI health in dogs actively experiencing large bowel diarrhea [9].
Methods. Investigators conducted an 8-week clinical trial on adult dogs experiencing chronic large-bowel diarrhea. All dogs received a high-fiber therapeutic diet formulated with multiple soluble and insoluble plant fibers. Fecal and serum samples were collected at baseline and several timepoints during the intervention. Untargeted metabolomics was used to profile fecal and serum to evaluate changes in gastrointestinal health and metabolic activity.
Results. The fiber-supplemented dietary intervention rapidly improved clinical signs of diarrhea. Significant increases in stool firmness were observed within one day and diarrhea resolved in most dogs within several weeks. Metabolomic analyses revealed significant changes in fecal and circulating metabolites that indicated a transition in gut microbial metabolism from protein fermentation (putrefaction) toward carbohydrate fermentation (saccharolysis) (Figure 17). The intervention reduced metabolites associated with bacterial protein breakdown and increased plant-derived metabolites and beneficial microbial postbiotics including indole derivatives. Additional metabolomic changes suggested improvements in inflammatory pathways, lipid metabolism, intestinal barrier integrity, and host-microbe interactions.
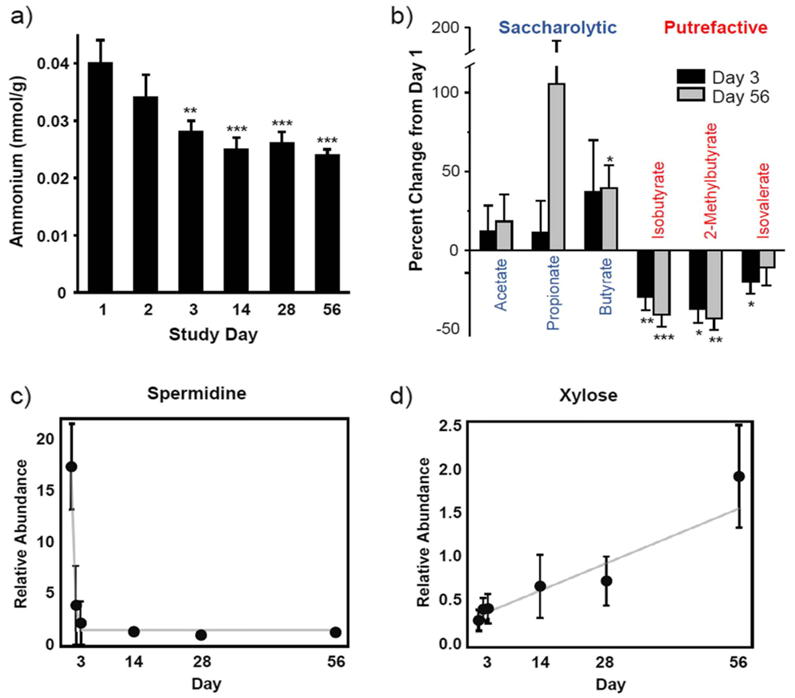
Figure 17. The impact of dietary intervention on fermentative metabolism. Dietary fiber intervention shifted metabolism away from protein fermentation towards carbohydrate metabolism as evidenced by reductions in (A) Fecal ammonium concentrations (A), short chain fatty acids (B), and spermidine (C) and increased monosaccharide xylose (D). Image reproduced from Fritsch et al., BMC Vet Res, 2022, licensed under CC BY 4.0.
Study Conclusions
- Overall, these study findings indicate that dietary fiber supplementation positively alters both microbial metabolism and host gastrointestinal physiology, demonstrating how dietary fiber confers its therapeutic effect.
- Metabolomics enabled investigators to directly measure the metabolic products produced in the gut, which provided functional insight into these mechanisms that could not have been deduced otherwise.
- The mechanistic evidence provided by the metabolomics data provided evidence of the efficacy of the nutritional intervention that could be used to support marketing claims.
Informing Early-Life Nutrition to Reduce Culling in Dairy Cows
Introduction. Early-life nutrition plays a crucial role in shaping long-term metabolic health. In dairy calves, insufficient nutrition before weaning is associated with reduced growth, impaired immune function, and poorer long-term productivity, while adequate nutrition tends to increase milk yield and support early reproductive maturity. The biological mechanisms linking early-life nutrition to productivity in adult cows are well documented but poorly understood.
Preliminary Data and Study Goals. Previous studies have shown that an adequate preweaning nutrient supply alters metabolic pathways related to energy, amino acid metabolism, and insulin sensitivity that remain in adulthood. In this study, investigators theorized that greater preweaning nutrient supply improves energy metabolism and long-term productivity in dairy cows [10]. The goal of this study was to test their hypothesis by determining how early-life milk intake influences metabolomic profiles, milk production, and survival through multiple lactations.
Methods. 78 Holstein cows were studied from the first to the fifth calving. Calves were randomly assigned to an elevated nutrient group which received 8 liters of milk replacer per day or to a restricted group which received 4 liters per day until weaning. Growth, reproductive performance, milk production, feed intake, and survival across lactations were monitored. Serum samples were collected on day 60 of lactation and analyzed using untargeted metabolomics to evaluate metabolic status during peak milk production.
Results. Calves receiving elevated levels of milk replacer showed greater early growth and improved insulin sensitivity later in development compared to restricted-fed calves. Elevated milk replacer cows also produced higher milk fat yields and fat content, and produced more milk when volumes were corrected for percentages of body fat and protein. Reproductive performance was similar between groups in the first lactation, but in the second lactation elevated milk replacer cows had a higher rate of conception after the first mating than restricted fed cows. Survival analysis showed that cows receiving higher early life nutrition had substantially lower risk of culling before later calvings (Figure 18). Metabolomic profiling at peak lactation revealed persistent metabolic differences between groups, including changes in amino acid, lipid, nucleotide, and carbohydrate metabolites (Figure 19). Pathways analyses identified alterations in metabolism of purines, pyrimidines, sphingosine, fatty acids, and the TCA cycle, suggesting that early-life nutrition influences long-term metabolic programming.
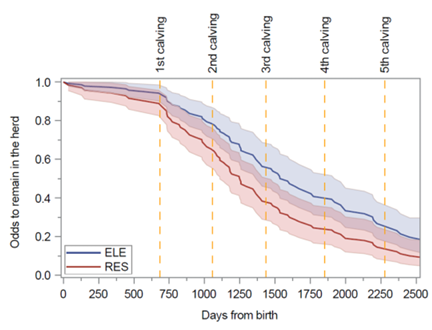
Figure 18. Probability that cows will remain in the herd, and thus avoid culling, in relation to days from birth for cows fed an enhanced (blue line) or restricted (red line) amount of nutrient intake before weaning. Image reproduced from Leal et al., J Dairy Sci, 2025, licensed under CC BY 4.0.
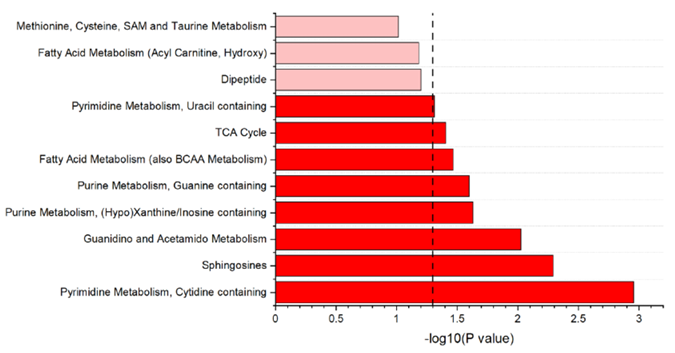
Figure 19. Visualization of meaningful metabolic pathways evidenced by enrichment analysis based on metabolites detected in serum of dairy cows at peak lactation. Metabolic pathways shown in darker red had p < 0.05; pathways shown in lighter red had p < 0.10. Image reproduced from Leal et al., J Dairy Sci, 2025, licensed under CC BY 4.0.
Study Conclusions
- This study’s findings demonstrate a direct link between early-life nutrition and long-term metabolic function, which can inform feed decisions to ultimately improve lifetime productivity and sustainability in dairy cattle leading to cost savings and nutritional benefits to humans.
Improving Beef Quality by Characterizing the Relationship Between Soil Quality, Feed, and Cattle Health
Introduction. In the American beef industry, cattle are usually fed corn-based diets for the last several months of life to maximize their growth and carcass quality. Animal feed crop production relies on monocultures, synthetic fertilizers, and irrigation which deplete soil nutrients, degrade soil structure, and contaminate water sources. Finishing animals on pasture using adaptive and rotational grazing practices has been shown to improve plant diversity, soil carbon, and general ecosystem function. Animals that graze fresh forages consume higher and more diverse polyphenol pools, and enrichment of these compounds in live-stock diets can improve animal metabolic health and increase the broader nutrient density of meat and milk. To better inform animal grazing practices more extensive research is needed to establish potential linkages between metrics of soil, animal, and plant health.
Preliminary Data and Study Goals. The goals of this study were to 1) determine the potential differences in the metabolite profiles of grass-fed and grain-fed beef, 2) evaluate them for associations with soil health and abundance of nutrients, and 3) evaluate health biomarkers in animals to gain insight into the potential impacts of varying nutritional statuses on their health and meat nutritional composition [11].
Results. Notable differences in soil health, feed composition, and beef metabolite profiles between pasture-based and grain-fed production systems were observed. Pasture soils generally showed higher soil organic matter, nutrient availability, and mineral levels compared to cornfield soils used for feed production. Untargeted metabolomics revealed substantial biochemical variation between pasture forage and grain-based mixed rations (Figure 20). Pasture contained higher levels of phytochemicals, phenolics, and omega-3-realted compounds, which grain rations had higher levels of dipeptides and omega-6-related metabolites. These dietary differences translated to the meat itself. Grass-fed beef contained higher levels of phenolic compounds, omega-3-fatty acids, long-chain acyl carnitines, antioxidants, and vitamin E and vitamin A derivatives. By contrast, grain-fed beef contained higher levels of certain dipeptides, sugars, B-vitamins, and markers of oxidative stress (Figure 21).
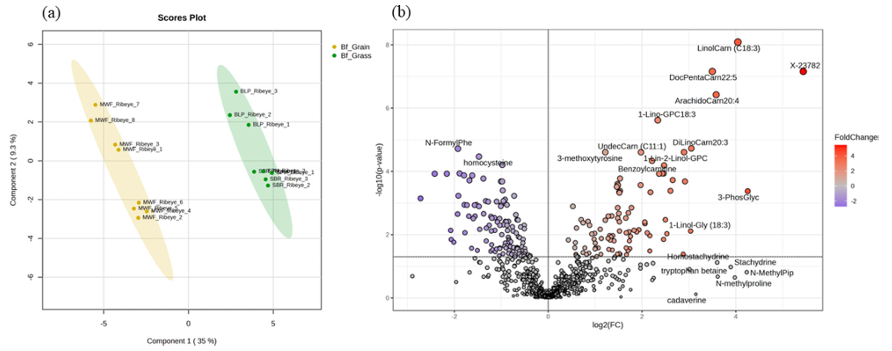
Figure 20. Multi- and univariate analysis of metabolite profiles in grass-fed and grain-fed beef samples. (A) Partial Least Squares Discriminant Analysis (PLS-DA) and (B) Volcano plot of differential metabolites in grass-fed (n=8) and grain-fed (n=8) beef samples. Image reproduced from Ahsin et al., NPJ Sci Food, 2025, licensed under CC BY 4.0.
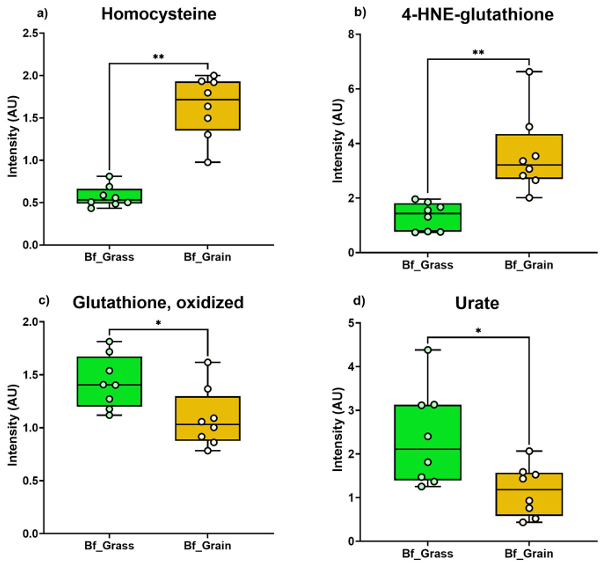
Figure 21. Oxidative stress and antioxidant markers in grass-fed (Bf_Grass) and grain-fed (Bf_Grain) beef. The bar graph shows the abundance of oxidative stress markers: (A) Homocystine, (B) 4-HNE-glutathione, and antioxidants: (C) Oxidized Glutathione, (D) Urate across both cattle groups. Image reproduced from Ahsin et al., NPJ Sci Food,2025, licensed under CC BY 4.0.
Chapter Takeaways
- Metabolomics is a highly valuable tool for gaining biological insight beyond what other omics sciences can provide.
- The insight gleaned from metabolomics can be key to cost savings and gaining an edge on the commercial competition.
Download the complete PDF guide
Download this comprehensive guide developed to teach you the ins and outs of one of the most powerful omics tools in any scientist’s toolbox: metabolomics.
Download nowContact Us
Talk with an expert
Request a quote for our services, get more information on sample types and handling procedures, request a letter of support, or submit a question about how metabolomics can advance your research.
Corporate Headquarters
617 Davis Drive, Suite 100
Morrisville, NC 27560
Mailing Address:
P.O. Box 110407
Research Triangle Park, NC 27709
+1 (919) 572-1711
International Headquarters
Metabolon GmbH
Zeppelinstraße 3
85399 Hallbergmoos
Germany