Chapter 5
Metabolomics for Basic Science
In this chapter, you'll learn how metabolomics can elucidate mechanisms that are invisible to other omics sciences to transform future therapeutic strategies, how it has revealed key insights that have significantly advanced our understanding and clinical implications of the microbiome-brain axis and population health, and how it can generate meaningful data from various sample matrices that are not commonly analyzed.
Overview
Metabolomics has been instrumental in advancing our understanding of basic science principals owing to the deep insight it provides regarding mechanisms that directly impact the phenotype, natural history of disease, and ability to spur discovery and hypothesis-generating findings. In recent years it has also contributed significantly to topics of special interest including microbiome-focused research and population health. Finally, its compatibility with uncommon sample matrices makes it broadly applicable to most areas of the life sciences. Here, we highlight a few studies that show how metabolomics can elucidate mechanisms and be applied to alternative sample types.
Mechanism
Cardiac remodeling in heart failure
Introduction. Heart failure (HF) is associated with impaired metabolic flexibility, in which the heart cannot augment glucose metabolism in response to stress, resulting in reduced cardiac efficiency and HF progression. In some circumstances, left ventricular (LV) systolic function can be restored if there is surviving myocardium and the underlying cause of HF is successfully treated. Cardiac resynchronization therapy (CRT) is a treatment for HF where a broad left bundle branch block causes dys-synchronous contraction between the septum and lateral wall of the LV. CRT acutely improves cardiac hemodynamics and oxygen efficiency, and further improvement in LV function is seen as remodeling occurs over time. The mechanisms that link CRT to long-term structural cardiac remodeling remain unclear. CRT has been shown to change the circulating metabolome over time, but it is not clear whether this is cause or effect.
Preliminary Data and Study Goals. Ultimately, an improvement in contractile function necessitates greater ATP delivery to the contractile machinery. Therefore, it is plausible that the degree of metabolic flexibility retained by the failing heart may be key to its ability to remodel. This goal of this study was to test this hypothesis by characterizing the degree of left ventricular remodeling in response to 6 months of CRT and determine whether CRT can acutely change substrate uptake away from the metabolic phenotype of HF to ultimately favor remodeling [16].
Methods. This study analyzed patients with HF alongside appropriate comparison groups using clinical phenotyping and global metabolomic profiling. After an overnight fast, patients were stabilized on an insulin/glucose infusion for at least 1 hour before CRT device implantation. Pressure-volume loop measurements and coronary arteriovenous samples were collected. The insulin/glucose infusion was stopped and an intralipid infusion started for 15 minutes, after which measurements were repeated. Arterial and venus blood samples were analyzed using untargeted metabolomics, and metabolic flexibility was assessed by evaluating uptake of certain metabolites and by calculating myocardial oxygen efficiency. Statistical and pathway analyses were used to identify metabolites associated with impaired metabolic flexibility.
Results. CRT caused a significant uptake in non-esterified fatty acids (NEFA) with no significant uptake in glucose, beta-hydroxybutyrate, or lactate (Figure 29). A strong correlation was observed between the acute improvement in cardiac hemodynamic performance induced by QRSd shortening from CRT. There was a strong positive correlation between the increased stroke work and NEFA uptake. The change in substrate uptake in response to CRT correlated with long term reverse remodeling of left ventricular end diastolic volume (Figure 30). There was significant correlation between the increase in NEFA uptake and reduction in LVEDV. Lipodomic analysis showed this was driven by increases in both long chain and medium chain fatty acids.
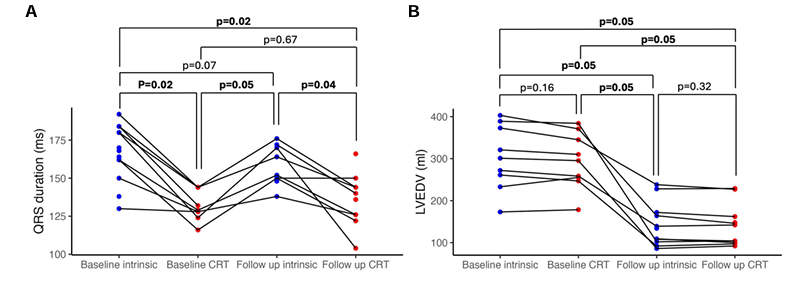
Figure 29. Chronic left ventricular remodeling after 6 months CRT, independent of acute changes in QRS duration. QRS duration (A, 13 patients) and left ventricular end diastolic volume (B, 9 patients) at baseline implant and 6 month follow up, with intrinsic rhythm and optimized cardiac resynchronization therapy pacing. Image reproduced from Green et al., Eur Heart J, 2025, licensed under CC BY 4.0.
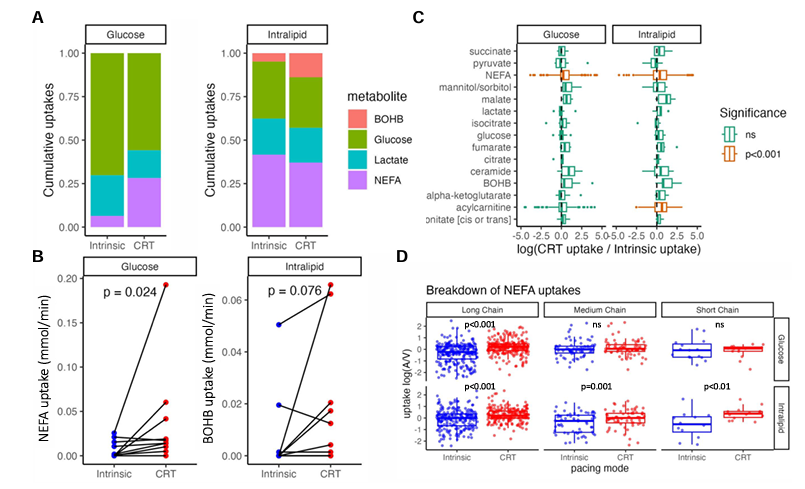
Figure 30. The effect of CRT on cardiac substrate uptake during insulin/glucose intralipid infusions. (A) Cumulative proportion of uptake of NEFAs, beta-hydroxybutyrate, lactate, and glucose during intrinsic conduction and optimized CRT while on intralipid and insulin/glucose infusions. (B) Illustration of the effect of cardiac resynchronization therapy on the uptake of non-esterified fatty acid and β-hydroxybutyrate while on insulin/glucose and intralipid infusions respectively. (C) metabolomic analysis illustrating the difference in uptake of intermediary metabolites induced by initiating cardiac resynchronization therapy, where positive values indicate increased uptake with cardiac resynchronization therapy. (D) lipidomic analysis illustrating the effect of cardiac resynchronization therapy on the uptakes [defined as log (arterial/venous)] of different chain length non-esterified fatty acid while on insulin/glucose and intralipid infusions. Image reproduced from Li et al., J Exp Med, 2014 licensed under CC BY 4.0
Study Conclusions
- These findings show that in non-ischemic cardiomyopathy the heart retains substantial metabolic flexibility, and CRT is thus able to reverse the metabolic phenotype of HF towards a more physiological phenotype of NEFA uptake.
- The degree of retained metabolic flexibility is correlated with long-term reverse remodeling of left ventricular end diastolic volume.
- In this study, metabolomics revealed that cardiac remodeling in response to CRT may rely on changes in cellular metabolism triggered by CRT rather than acute effects of QRSd narrowing.
Identifying a Novel Therapeutic Target for Diabetic Kidney Disease
Introduction. Diabetic kidney disease (DKD) is a leading cause of chronic kidney disease and kidney failure. Although sodium-glucose cotransporter 2 (SGLT2) inhibitors were originally developed to lower blood glucose by increasing urinary glucose excretion, clinical trials have shown that they also provide strong renal and cardiovascular protection, even in patients without diabetes. However, the biological mechanisms responsible for these protective effects remain unclear, particularly because SGLT2 is expressed only in proximal tubular cells (PTCs) of the kidney, raising the question of how targeting a transporter in a limited cell population can improve overall kidney function.
Preliminary Data and Study Goals. Prior studies suggest that diabetic kidneys exhibit substantial metabolic alterations, including increased glycolysis and mitochondrial dysfunction, which SGLT2 inhibition may normalize. Thus, study investigators hypothesized that loss or inhibition of SGLT2 alters metabolic pathways within kidney cells to produce metabolites that protect the kidney. The goal of this study was to test this hypothesis by using metabolomic, transcriptomic, and epigenetic analyses to identify metabolic changes in PTCs lacking SGLT2 function and determine whether these pathways contribute to kidney protection [17].
Methods. Male wildtype (WT) and SGLT2 loss-of-function “Sweet Pee” (SP) mice were fed either a normal diet or a high-fat diet (HFD) for up to 18 weeks to induce metabolic stress and early diabetic kidney disease. Kidney function, histology, and metabolic parameters were assessed by measuring serum creatinine and urine albumin-to-creatinine ratio, and by immunostaining kidney tissue for markers of injury and fibrosis. Single-cell RNA sequencing (scRNA-seq) was performed in proximal tubular cells, and untargeted metabolomic profiling was performed on kidney cortex and serum. CUT&RUN epigenetic profiling was performed to measure histone methylation changes associated with altered metabolite levels.
Results. In mice fed a high-fat diet, those lacking SGLT2 function showed less kidney damage, inflammation, fibrosis, and proteinuria than wild type mice, despite similar metabolic stress. Single-cell RNA sequencing identified a population of injured proximal tubular cells that emerged in wild type kidneys under high-fat diet conditions but was largely suppressed in the absence of SGLT2 function. Metabolomic analysis revealed that kidneys lacking SGLT2 had increased activity of methionine metabolism, particularly higher levels of the metabolite S-adenosylmethionine (SAM) (Figure 31). Functional experiments showed that blocking the SAM-producing enzyme MAT2A eliminated the protective effects of SGLT2 loss, while SAM supplementation reduced inflammatory responses in cultured kidney cells exposed to metabolic stress (Figure 32). Pharmacologic SGLT2 inhibition produced similar protective effects as genetic SGLT2 loss. Finally, epigenetic analyses showed that elevated SAM increased repressive histone methylation (H3K27me3) at promoters of inflammatory genes, including those in the NF-κB pathway, leading to reduced inflammatory signaling. Together, these results indicate that SGLT2 inhibition promotes kidney protection by increasing SAM-mediated epigenetic repression of inflammatory pathways during metabolic stress.
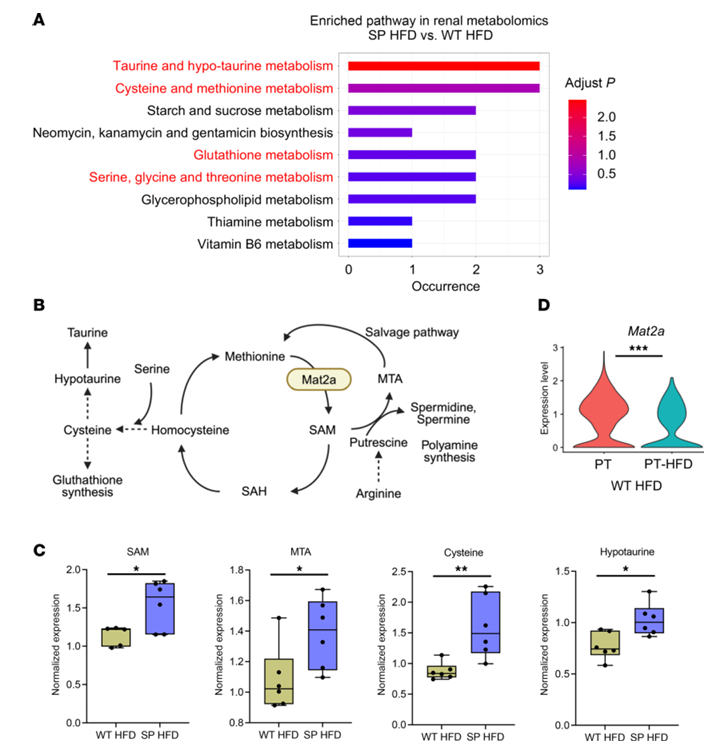
Figure 31. Metabolic profiles in the kidney. (A) Metabolic enrichment pathway analysis in tissue isolated from the renal cortex. Color indicates adjusted P value. (B) Methionine metabolism and network pathways. (C) Relative expression of SAM, MTA, and metabolites related to cysteine and taurine metabolism in renal cortex (n = 6 per group). Boxes show the 25th to 75th percentiles, center lines indicate medians, whiskers extend to min and max, and all data points are shown. (D) Violin plot showing proximal tubule expression of Mat2a in normal proximal tubule cells (PT) and the subpopulation of PTC (PT-HFD) that emerged in wild-type mice fed a high-fat diet (WT HFD). Image reproduced from Maekawa et al., J Clin Invest, 2025, licensed under CC BY 4.0.
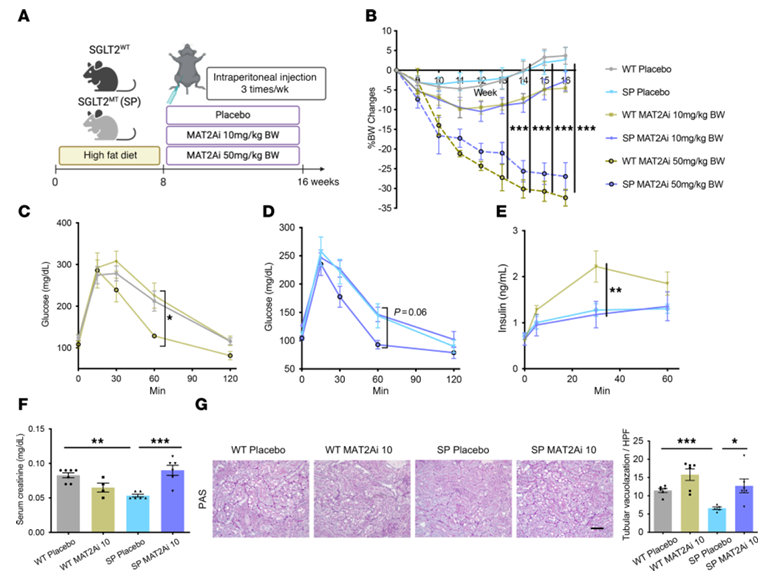
Figure 32. Inhibition of methionine enzyme, MAT2A, abrogates kidney protection in SPHFD mice. (A) Schematic protocol. (B) Chronological changes in per centage of BW change. (C–E) Low-dose MAT2Ai does not alter glucose tolerance and insulin secretion capacity, but high dose MAT2Ai does lower them. (F) Serum creatinine level. (G) Representative images of PAS staining. Image reproduced from Maekawa et al., J Clin Invest, 2025, licensed under CC BY 4.0
Study Conclusions
- This study provides evidence that metabolites play an active regulatory role in progression of chronic kidney disease and suggest that targeting methionine metabolism or SAM-related pathways could be a viable therapeutic strategy for patients who cannot tolerate SGLT2 inhibitors.
- Metabolomics was crucial in characterizing the relationship between SGLT2 inhibition, kidney metabolism, and the inflammatory response in mice, which can serve as a springboard for future human studies.
Identifying a Potentially Preventative Treatment for an Aggressive Malignancy
Introduction. Pancreatic ductal adenocarcinoma (PDAC) is the third leading cause of cancer death worldwide and one of the few cancers that is becoming more prevalent globally. Currently, the five-year survival rate sits at 13%, largely due to most diagnoses occurring at a later stage after the tumor has metastasized and resection is no longer an option. More than 90% of PDAC tumors contain activating KRAS mutations, making KRAS a central driver of tumor growth and an attractive therapeutic target. However, clinical responses to KRAS inhibitors and drugs targeting the KRAS signaling pathway (such as RAF/MEK/ERK inhibitors) have been limited, with only partial responses and rapid development of drug resistance. Most current combination strategies focus on components within the canonical KRAS signaling pathway, but cancer cells can bypass these targets through compensatory mechanisms, highlighting the need to identify new vulnerabilities outside the traditional KRAS pathway.
Preliminary Data and Study Goals. To address this unmet need, study investigators sought to identify genes that are essential for KRAS-mutant PDAC cell survival with the goal of discovering novel therapeutic targets and combination strategies that could potentially improve the effectiveness of KRAS inhibitors in pancreatic cancer [18].
Methods. Genome-wide CRISPR/Cas9 knockout screens, RNA interference datasets, and large cancer dependency databases were used to identify genes that are selectively essential for KRAS-mutant PDAC cells. Drug sensitivity screens were performed to identify compounds that preferentially inhibit KRAS-mutant cells. Candidate genes were validated using gene knockdown or knockout approaches and cell viability assays in PDAC cell lines. RNA sequencing, metabolomics, proteomics, and stable isotope tracing were used to analyze changes in nucleotide metabolism and cellular pathways after gene inhibition or KRAS blockade. The functional importance of targets was further tested using genetically engineered mouse models and orthotopic tumor transplantation models. Proteolysis-targeting chimera (PROTAC) compounds that selectively degrade IMPDH2 were used to test their therapeutic potential in patient-derived organoids and xenograft tumor models.
Results. De novo guanine nucleotide biosynthesis (DNGB) was identified as a key metabolic vulnerability in KRAS-mutant PDAC cells with the critical gene being IMPDH2, which encodes an enzyme critical to DNGB. Pharmacological suppression of IMPDH2 or other DNGB enzyme activity significantly reduced PDAC cell growth. In mouse models, genetic deletion of Impdh2 reduced pancreatic tumor initiation, slowed disease progression, and improved A GUIDE TO ME TA BO LO MIC S survival (Figure 33). Metabolomic analyses showed that mutant KRAS stimulates purine biosynthesis to preferentially increase production of adenine nucleotides over guanine nucleotides, creating a metabolic “bottleneck” for guanine synthesis (Figure 34). As a result, PDAC cells become dependent on IMPDH2 to maintain guanine nucleotide levels and continue proliferating. Inhibiting IMPDH2 depleted guanine nucleotides, which impaired PDAC cell growth. Importantly, IMPDH2 expression was shown to not be regulated by the canonical KRAS signaling pathway, meaning that cancer cells could not compensate for IMPDH2 inhibition through KRAS signaling. A selective IMPDH2-degrading compound (MED-B-4) suppressed growth of PDAC cell lines with greater potency than existing IMPDH inhibitors.
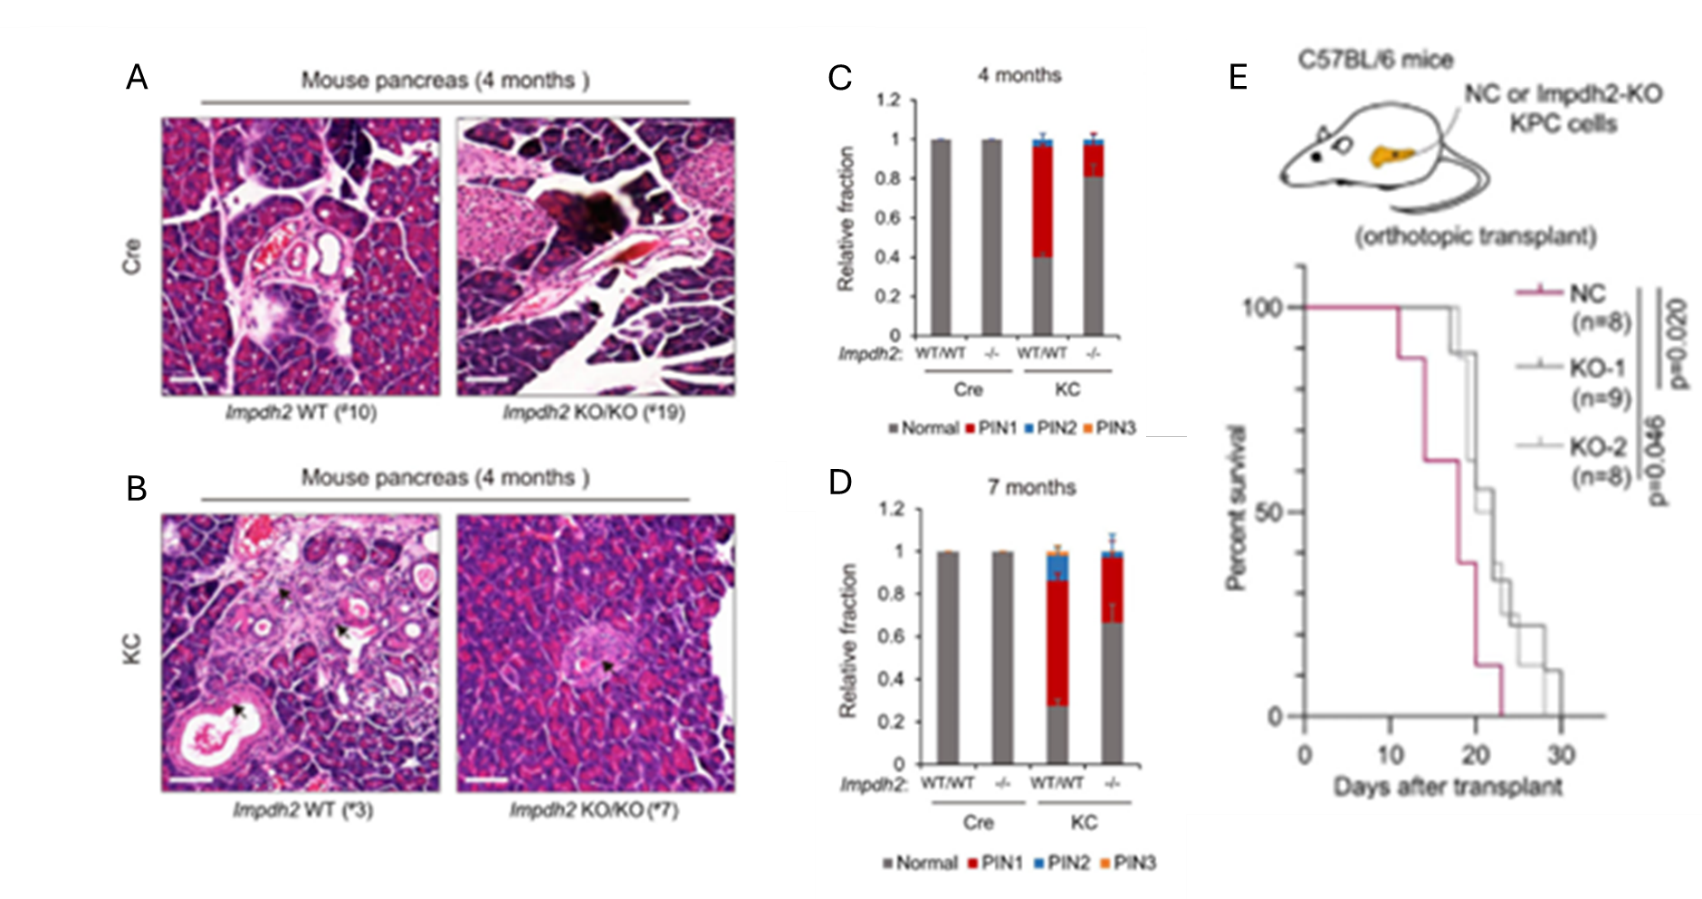
Figure 33. DNGB inhibition or conditioned Impdh2 knockout inhibits pancreatic carcinogenesis and cancer progression in vivo. Representative images of H&E staining in pancreatic tissue specimens from control and (Cre; Impdh2-/-) mice (A), or from KC and (KC; Impdh2-/-) mice (B). Frequency of pancreatic intraepithelial neoplasia (PanIN or PIN) lesion stages (PIN 1, PIN 2 and PIN 3) in different genotype mice 4 months of age (C) or 7 months of age (D). Overall survival plot of the mice orthotopically transplanted with negative control KPC cells, a transformed PDAC cell line, or Impdh2 knockout KPC cells (E). Image reproduced from Wu et al., Gut, 2026, licensed under CC BY 4.0.
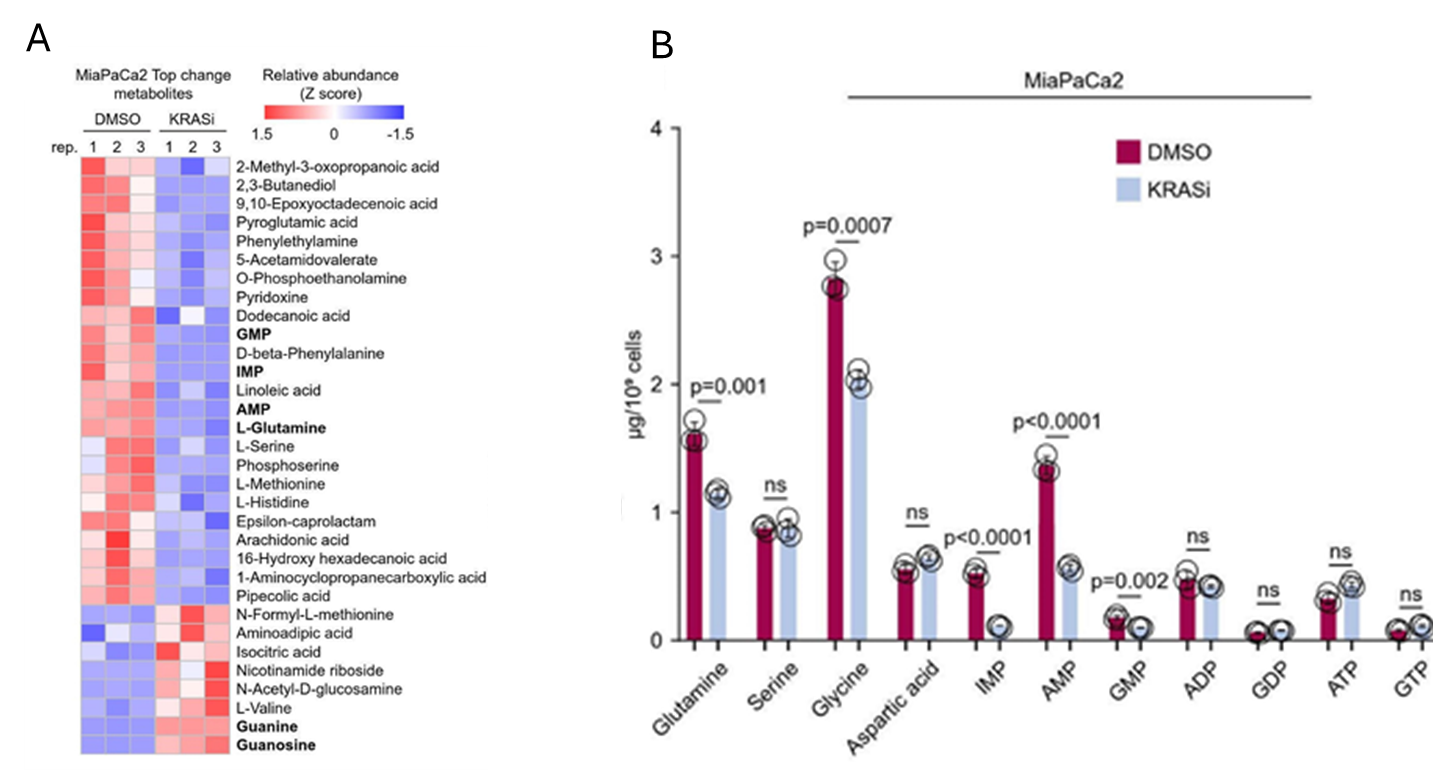
Figure 34. Mutant KRAS stimulates de novo biosynthesis of adenine more than guanine nucleotides. (A) Heat map showing the metabolites which are significantly and consistently changed on acute inhibition of mutant KRAS(G12C) in the transformed PDAC cell line, MiaPaCa2 cells as determined by untargeted metabolomics assays. (B) Quantification of amino acids and purine nucleotides using targeted LC- MS/MS In the control and KRAS inhibition cells (control: DMSO for 120 min; KRAS inhibition: 100 nM AMG510 for 120 min). Image reproduced from Wu et al., Gut, 2026, licensed under CC BY 4.0.
Study Conclusions
- Prior to this study de novo guanine nucleotide biosynthesis was an underappreciated metabolic vulnerability in KRAS-mutant PDAC. Metabolomics played an important role in showing that KRAS uniquely enhances adenine nucleotide production to create a shortage of guanine nucleotides, making PDAC cells dependent on IMPDH2, the key enzyme responsible for converting inosine monophosphate to guanine nucleotides.
- Importantly, since IMPDH2 is not regulated by the canonical KRAS signaling pathway, PDAC cells cannot compensate for its inhibition through typical KRAS pathway feedback mechanisms. This led to the discovery that blocking IMPDH2 causes irreversible guanine nucleotide depletion, which disrupts DNA/RNA synthesis and suppresses tumor growth.
- These findings have implications for future therapies, as they suggest that selective degradation of IMPDH, rather than broad inhibition, could provide a more precise strategy for PDAC treatment.
Microbiome
Elucidating Mechanisms that Link the Microbiome to Multiple Sclerosis
Introduction. Microbial metabolites have been shown to influence immune regulation, inflammation, and neurological function, suggesting they may contribute to disease activity or progression. Various studies have identified abnormalities in the gut microbiomes of patients with multiple sclerosis (MS), but a role for intestinal microbes and their metabolites in MS pathology has yet to be established.
Preliminary Data and Study Goals. The goal of this study was to determine whether specific gut microbes and circulating stool metabolites are associated with worsening MS or the transition to progressive disease by analyzing longitudinal clinical, microbiome, and metabolomics from participants in a well-characterized MS cohort [19].
Methods. This study analyzed participants from the Comprehensive Longitudinal Investigation of Multiple Sclerosis (CLIMB) cohort, and associated clinical data, MRI imaging, and banked plasma and feces. Investigators followed patients for approximately two years and categorized them into groups defined by: 1) stable disease, 2) worsening disability, and 3) having transitioned from relapsing-remitting MS to progressive MS. Shotgun metagenomic sequencing was performed on stool samples to characterize gut microbiota. Both stool and serum samples were analyzed using global metabolomics profiling to measure microbial and host-derived metabolites. Statistical models were used to identify associations between microbial taxa, metabolite levels, and changes in clinical outcomes including disability progression, MRI findings, and quality of life measures.
Results. Significant associations between the composition of gut microbiota, metabolite profiles, and MS disease progression were identified. Individuals who experienced worsening disease or a transition to progressive MS showed reduced levels of several beneficial microbial taxa, including species known to produce short-chain fatty acids and other anti-inflammatory metabolites (Figure 35). By contrast, higher levels of metabolites produced by these beneficial microbes were associated with stable disease. Microbial features and metabolite levels were associated with disability score, MRI indicators of disease activity, and patient-reported outcomes, indicating that microbiome-derived metabolic changes may play a direct role in MS disease progression (Figure 36).
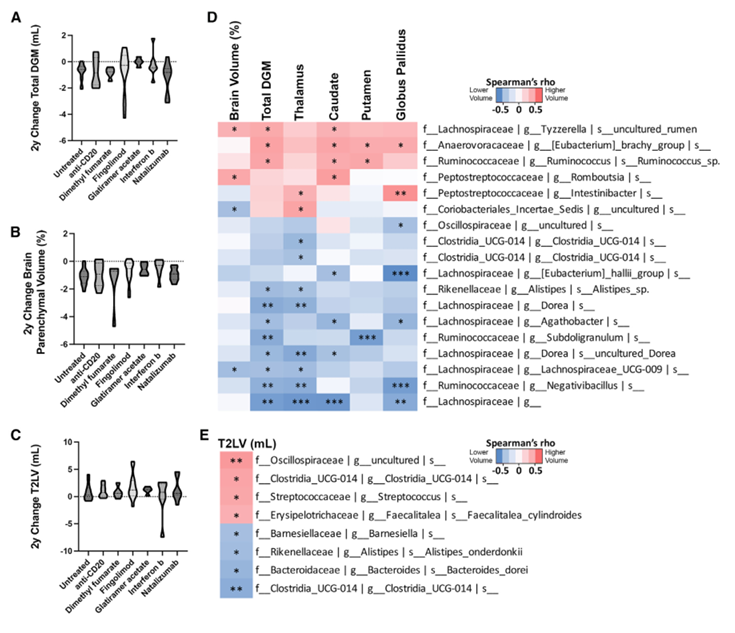
Figure 35. Gut microbes correlate with 2-year changes in 3T MRI. Changes in DGM (A), whole brain parenchymal volume (B), and T2LV stratified by DMT (C). Spearman’s correlations demonstrate microbial taxa significantly positively (red) or negatively (blue) correlated with 2-year changes in 3T volumetric measures (D). Spearman’s correlation demonstrates taxa positively (red) or negatively (blue) correlated with T2LV (E). Image reproduced from Schwerdtfeger et al., Ce ll Rep Med, 2025, licensed under CC BY 4.0.
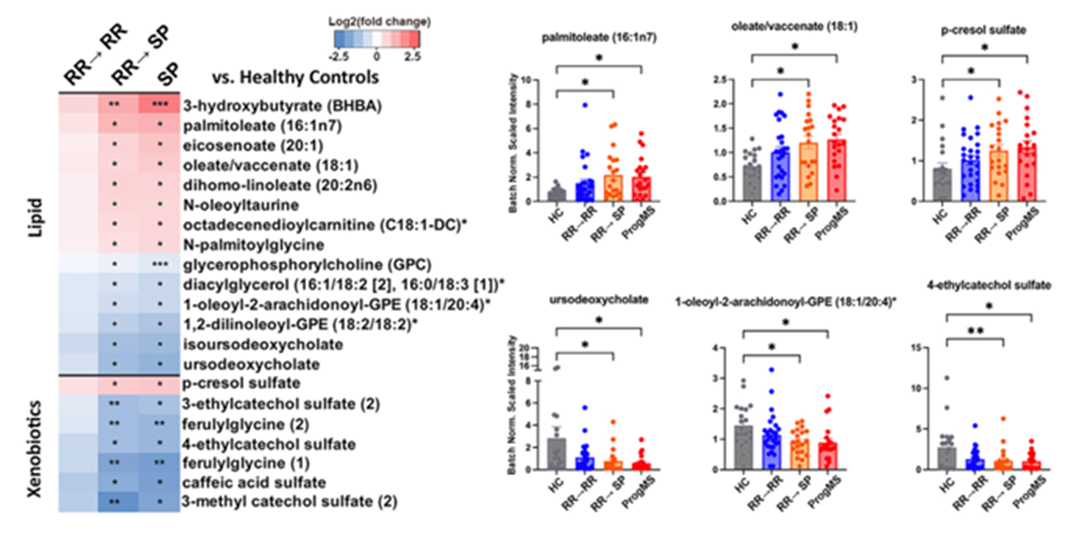
Figure 36. Serum metabolites linked to development of progressive MS. (A) All serum metabolites that were significantly altered in patients who transitioned from relapse-remitting (RR) disease to stable progressive (SP) disease. (B) Bar graphs with individual values of biologically relevant metabolic alterations by disease status. Image reproduced from Schwerdtfeger et al., Cell Rep Med, 2025, licensed under CC BY 4.0
Study Conclusions
- The findings of this study support the idea that the gut microbiome may influence MS through metabolic signaling pathways and immune modulation, and the microbial taxa and metabolites identified may serve as biomarkers of disease progression or novel therapeutic targets that could be modulated by diet.
- Without metabolomics, investigators would have only been able to observe shifts in microbial species and would not have learned which metabolic pathways were disrupted, which bioactive molecules might influence immune signaling and neuroinflammation, or which molecules could be further investigated as potential therapeutic targets.
Understanding the Microbiome’s Influence on Type 2 Diabetes Pathophysiology
Introduction. Type 2 diabetes (T2D) is a complex metabolic disease influenced by genetic, environmental, and microbial factors. Increasing evidence suggests that the gut microbiome contributes to metabolic health by producing bioactive metabolites that affect host physiology, including glucose metabolism and inflammation. Although microbiome sequencing studies have identified microbial taxa associated with T2D, they do not fully explain the functional biochemical mechanisms linking gut microbes to metabolic disease.
Preliminary Data and Study Goals. Given that microbial metabolites act as signaling molecules that influence host metabolism, investigators attempted to characterize how microbial metabolic activity contributes to T2D risk and progression by performing metagenomic sequencing and global metabolomics analyses [20].
Methods. This study analyzed cohorts with known diabetes status and metabolic phenotyping data. Metagenomic sequencing was used to characterize the composition and abundance of the gut microbiome. Plasma and stool were analyzed by global metabolomics profiling to measure a broad range of host- and microbe-derived metabolites. Statistical analyses were used to identify metabolite and microbial taxa associated with T2D and related metabolic traits including insulin resistance and glycemic control. Integrative analyses were used to identify connections between specific microbes and metabolites to determine how microbial metabolic pathways influence host metabolic phenotypes.
Results. Individuals with T2D had distinct microbiome and metabolite profiles compared to healthy individuals. Several microbial taxa were associated with altered concentrations of metabolites involved in amino acid metabolism, lipid metabolism, and microbial fermentation pathways. Metabolomics revealed specific microbial-derived metabolites that were significantly correlated with measures of insulin resistance and glucose regulation (Figure 37). Interestingly, metabolites associated with T2D were shown to reverse in response to diet or exercise intervention (Figure 38). Some metabolites showed stronger associations with T2D risk than the microbial taxa themselves, suggesting that microbial metabolic activity rather than simple microbial abundance may be a key driver of disease-related metabolic changes.
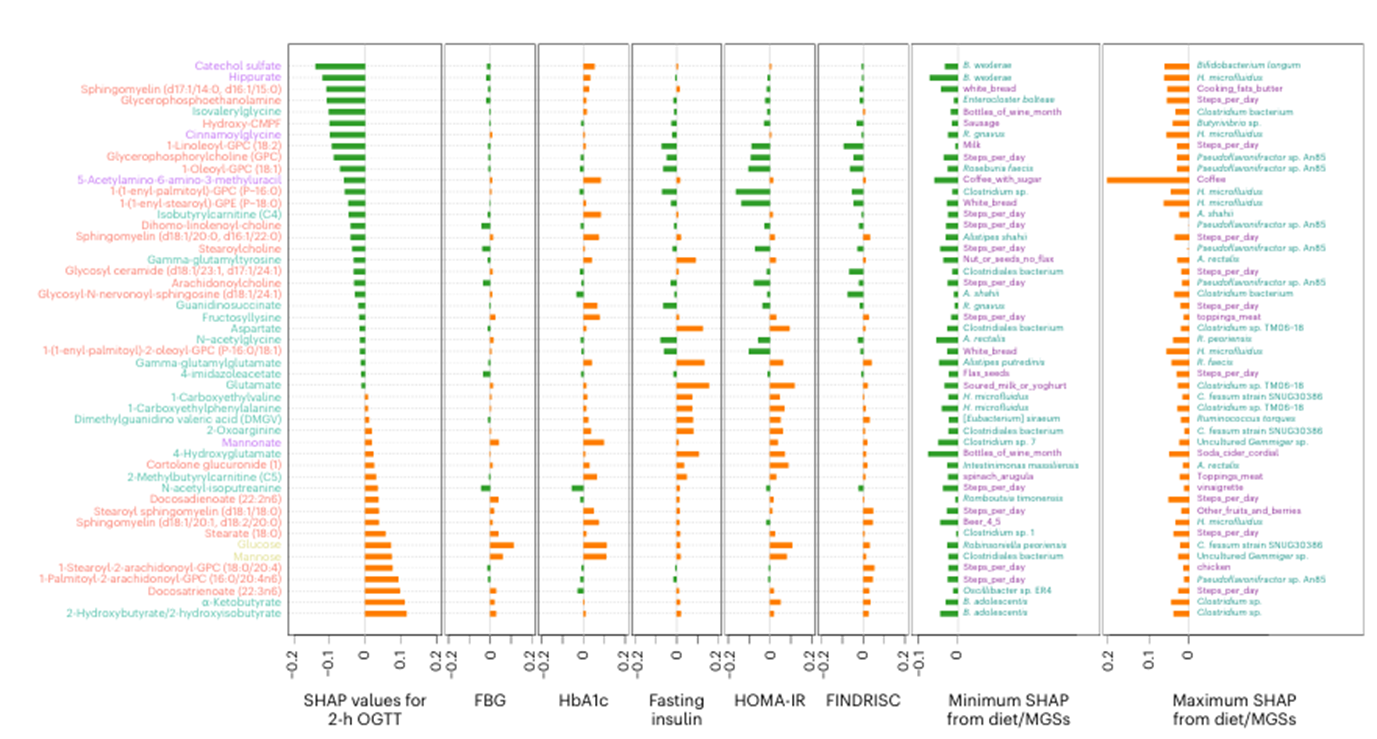
Figure 37. Gut microbial features explaining glucose intolerance. Top ten metabolites identified as important features in the 2-hour oral glucose tolerance test (OGTT), fasting blood glucose (FBG), AbA1c, fasting insulin, homeostatic model assessment of insulin resistance (HOMA-IR) or Finnish Diabetes Risk Score (FINDRISC) (n=49). Image reproduced from Wu et al., Nat Med, 2025, licensed under CC BY 4.0.
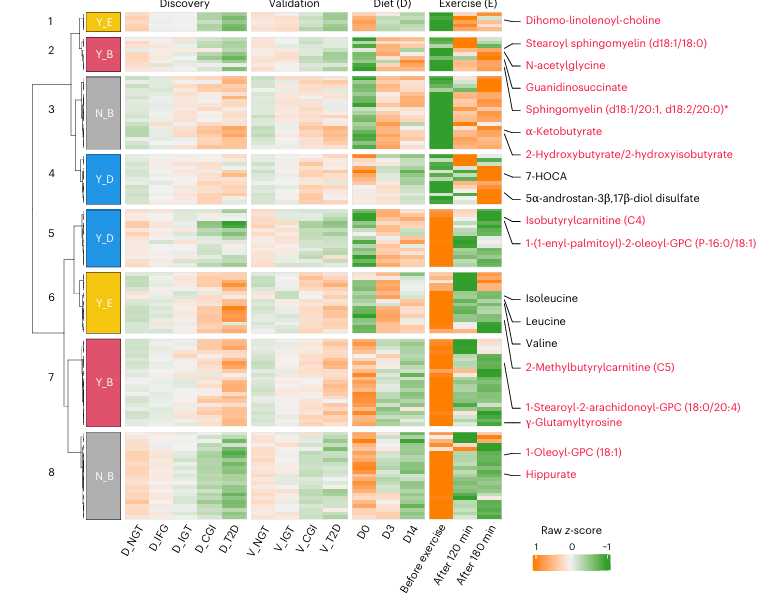
Figure 38. Responses of prediabetes and T2D-associated metabolites to a 2-week diet intervention or before and after exercise. Heatmap showing the overlapping metabolites involved in amino acid, lipid and xenobiotic metabolism (n = 123) in two clinical trials of either diet (14 days) or exercise for 1-h (before, 120 and 180 min after exercise) interventions with those 502 altered metabolites in prediabetes and T2D. Responses reversed (Y, yes; N, no) by either diet (D) or exercise (E) or both (B) were clustered and are shown in distinct colors beside the row clustering branches. Representative metabolites are labeled in red, and five others in black. Image reproduced from Wu et al., Nat Med, 2025, licensed under CC BY 4.0.
An Understudied Link Between Symptoms of Irritable Bowel Syndrome and Cognition
Introduction. Irritable bowel syndrome (IBS) is a gastrointestinal disorder characterized by recurrent abdominal pain and altered bowel habits. Brain-gut-microbiome interactions are becoming recognized as important regulators of gastrointestinal function, symptom perception, and mood, which have marked them as targets for therapeutic intervention in IBS. Cognitive behavioral therapy (CBT) is an effective brain-targeted intervention that teaches information processing skills to address psychological factors known to exacerbate abdominal symptoms including maladaptive coping, intense worry, and stress reactivity.
Preliminary Data and Study Goals. One research group previously showed in a large randomized clinical trial that two CBT programs tailored for IBS were effective in producing sustained gastrointestinal symptom improvement compared to an IBS education program that controlled for nonspecific effects from undergoing treatment. Based on these findings the study team theorized that CBT alleviates symptoms by modulating primarily the brain component of the brain-gut-microbiome (BGM) axis and that microbial signals to the brain in the form of neuroactive metabolites including short-chain fatty acids and serotonin could modulate responsiveness to the biological effects of CBT. Thus, the goal of this study was to determine whether metabolic signatures in IBS patients are associated with cognitive performance and symptoms related to the BGM [21].
Methods. Eligible patients were randomized to receive 10 sessions of clinic-based CBT or 4 sessions of largely home-based CBT with minimal therapist contact over a 10-week acute phase. All participants underwent baseline and post-treatment MRI imaging sessions. Clinical questionnaires were used to assess the severity of gastrointestinal symptoms. Stool samples were analyzed using 16S rRNA gene sequencing and untargeted metabolomics. Statistical analyses identified metabolites associated with IBS status, cognitive performance, and symptom severity.
Results. Of the 84 IBS participants who underwent neuroimaging, 58 were classified as CBT responders while 26 were classified as non-responders based on 50-point or greater decrease on the IBS Symptom Severity Scale post-treatment. Microbial beta diversity was significantly different between responders and non-responders, and the abundance of the microbiome-derived neurotransmitter serotonin was significantly increased in responders. Following CBT, responders showed a decrease in connectivity between multiple regions associated with specific brain networks related to emotional regulation (Figure 39). Notably, these changes were accompanied by a significant decrease in both abdominal pain and perceived stress. Amongst patients who responded to CBT, Bacteroides were higher at baseline compared to non-responders (Figure 40). A random forest classifier containing 11 bacterial genera was used to predict CBT response. This classifier was able to accurately predict CBT response, demonstrating that the microbiome can serve as an effective biomarker for evaluating a patient’s potential response to treatment and prioritizing likely positive responders for CBT.
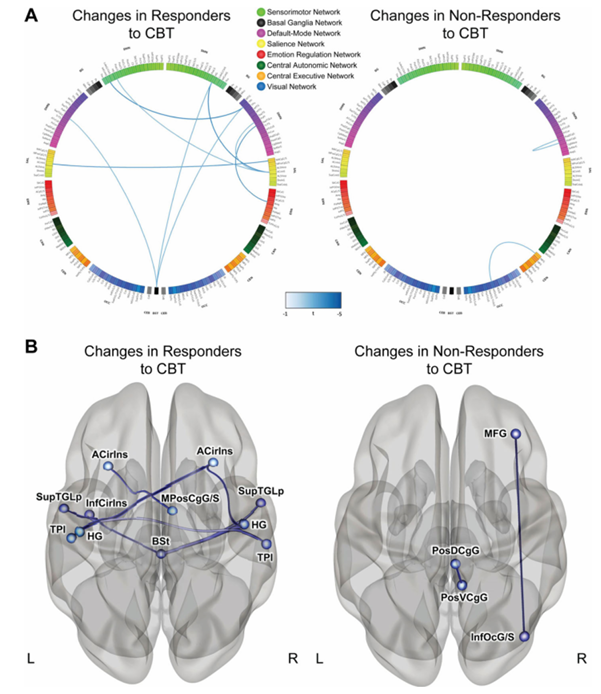
Figure 39. Changes in functional connectivity in responders and non-responders to CBT. (A) Connectograms showing pair-wise connectivity differences between groups. Blue lines indicate significant decreases in connectivity. (B) Regions that significantly differed between responders and non-responders to CBT. Image reproduced from Jacobs et al., Microbiome, 2021, licensed under CC BY 4.0.
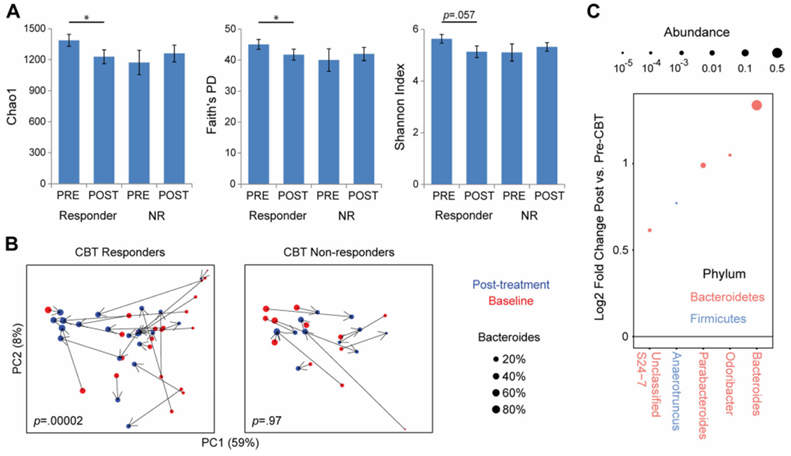
Figure 40. CBT responders have altered intestinal microbiome composition after CBT characterized by Bacteroides expansion. (A) Fecal microbial alpha diversity is shown for CBT responders and non-responders (NR) at baseline (PRE) after CBT (POST). (B) Principal coordinates analysis of 16S rRNA sequence data before and after CBT, stratified by CBT response status. Each dot represents a sample, colored by time point (red= baseline, blue= post-CBT) and sized by Bacteroides abundance. (C) Microbial genera with statistically significant association with CBT responder status are shown. Image reproduced from Jacobs et al., Microbiome, 2021, licensed under CC BY 4.0.
Study Conclusions
- These findings suggest a microbiome-based mechanism by which IBS patients experience pain in the absence of pathology and provide novel avenues for components of the BGM axis as biomarkers for IBS treatment.
- Metabolomics was essential for this study because it enabled direct measurement of gut-brain signaling molecules that link gastrointestinal dysfunction to cognitive symptoms in IBS, helping to unravel the complex connection between the microbiome and human health.
Population Health
Finding Novel Associations Between Biochemical Pathways and Noncommunicable Diseases to Explain Multimorbidity
Introduction. Multimorbidity, the co-occurrence of multiple chronic diseases, is a substantial global health burden that is becoming more prevalent. Before thisproblemcanbeadequatelyaddressed, wemustgainabetterunderstanding of disease risk factors and mechanisms of disease progression. Although many chronic conditions share risk factors and biological mechanisms, the majority of studies are limited to single diseases. Molecular profiling could identify common biological pathways that predispose individuals to multiple diseases. To this end, investigators performed untargeted metabolomic profiling on plasma samples collected from the European Prospective Investigation into Cancer (EPIC)-Norfolk cohort [22].
Preliminary Data and Study Goals. The goal of this study was to identify shared metabolic pathways, determine which associations are driven by modifiable risk factors, and highlight metabolites linked to the development of multiple chronic conditions.
Methods. Plasma samples from 11,966 individuals from the EPIC-Norfolk cohort were profiled using untargeted metabolomics. Incident diseases and mortality were identified through long-term follow-up using linked electronic health records, hospitalization data, and cancer registries that covered over 219,000 person-years. Associations between metabolite levels and disease incidence were assessed using Cox proportional hazards models adjusted for age and sex. Linear regression was used to examine metabolite associations with multimorbidity.
Results. Findings revealed 458 metabolites associated with at least one disease outcome, which produced 1226 metabolite-disease associations overall. 65.5% of significant metabolites were associated with two or more diseases, indicating extensive biological overlap among chronic conditions. Strong connections were observed across cardiometabolic, respiratory, renal, and liver diseases, and many metabolites showed consistent directions of association across multiple conditions (Figure 41). Mediation analyses showed that many metabolite-disease relationships were associated with common risk factors including obesity, smoking, inflammation, glucose resistance, and elevated lipid levels. Some metabolites were uniquely associated with specific diseases, while 30 metabolites were significantly linked to the development of multimorbidity (Figure 42).
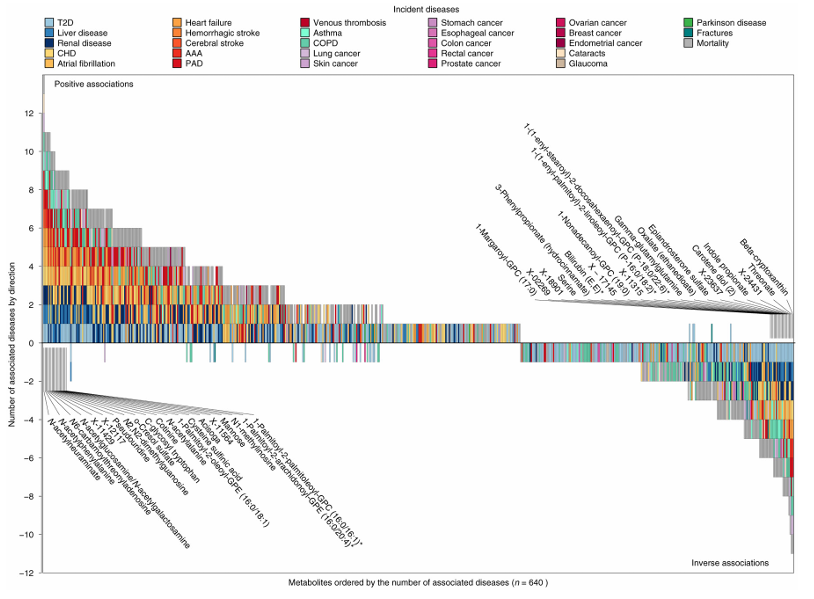
Figure 41. Brick plot showing the ranking of metabolites based on the number of associated disease end points. P < 0.001 was considered significant accounting for 28 diseases tested for each metabolite. The x axis shows the rank of each metabolite according to the number of associated metabolites, counting inverse associations as negative numbers to simplify the representation of results. The y axis shows the number of associated metabolites, whereby positive numbers indicate positive associations, and negative numbers indicate inverse associations. The colors of each box indicate the associated disease end point. Selected metabolites with multiple associated end points are annotated. Image reproduced from Pietzner et al., Nat Med, 2021, licensed under CC BY 4.0.
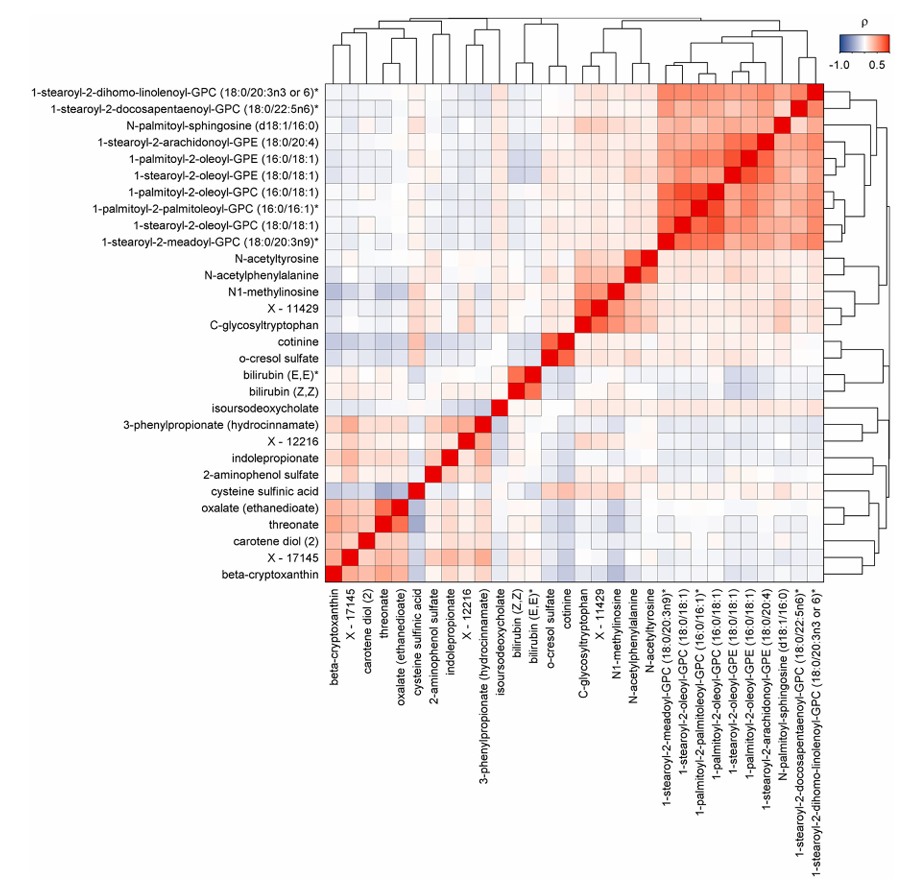
Figure 42. Pairwise correlation heatmap of multimorbidity candidate metabolites. Pairwise correlation matrix of plasma metabolites significantly associated with the incidence of noncommunicable disease multimorbidity. Colors indicate positive (red) or inverse (blue) correlations and black frames indicate statistical significance after correction for multiple testing. Image reproduced from Pietzner et al., Nat Med, 2021, licensed under CC BY 4.0.
Study Conclusions
- In this study untargeted metabolomics was instrumental in identifying biochemical pathway associations shared across multiple diseases, which provided both mechanistic insight into disease risk and practical insight for development of future therapies.
- In many cases, pathways that were associated with more than one disease demonstrated the same directions of association with each disease individually. This suggests that future interventions could target shared pathways to prevent multiple illnesses.
- This study’s findings could also guide the identification of subtypes of multimorbidity by investigating how those pathways associate with co-occurrence of seemingly unrelated diseases.
Predicting Biological Age to Better Assess Disease Risk
Introduction. Chronological age is a major risk factor for numerous diseases, but it does not capture the complex biological aging process or the substantial variability of biological aging between individuals. The difference between chronological aging and biologically driven aging could be a more informative reflection of health status than chronological aging alone. Biological aging reflects complex interactions among genetic, lifestyle, and environmental factors, and identifying biomarkers that better represent this process could improve understanding of disease risk and health trajectories. Metabolomics is a promising approach because circulating metabolites reflect both endogenous metabolic activity and external exposures including diet, medications, and environmental factors.
Preliminary Data and Study Goals. Previous metabolic age prediction studies have been limited by small sample sizes, targeted metabolite panels, or restricted age ranges, which may reduce predictive accuracy and generalizability. Therefore, the goals of this study were to develop a robust metabolomic age prediction model by performing untargeted metabolomics profiling on INTERVAL, a large population-based cohort, and to evaluate whether the resulting metabolomic age estimates were associated with health outcomes [23].
Methods. The INTERVAL study is a prospective cohort study of approximately 50,000 participants nested within a randomized sample of blood donors. In this study, plasma samples from 12,000 health blood donors, aged 18-75 years were analyzed using global metabolomics. Ridge regression combined with bootstrapping was used to build and internally validate models that predicted chronological age based on metabolite profiles. Separate models were also constructed using only endogenous metabolites and using sex-specific data for men and women. The resulting metabolomic age predictions were then tested in the Netherlands Epidemiology of Obesity (NEO) study to determine whether differences between predicted metabolomic age and chronological age were associated with health characteristics.
Results. The metabolomic age prediction models demonstrated strong performance, explaining more than 80% of the variation in chronological age when both endogenous and xenobiotic metabolites were included (Figure 43). Key metabolites that strongly contributed to age prediction included hydroxyasparagine, vanillylmandelate, and 5,6-dihydrouridine. When the model was applied to the NEO cohort, higher metabolomic age relative to chronological age was associated with obesity and cardiovascular disease, partly due to the xenobiotic metabolites reflecting the use of medication and environmental factors such as cotinine (Figure 44). The study also identified 163 metabolites that differed between men and women, and sex-specific models showed high predictive performance but only moderate correlation with each other, suggesting that these models captured meaningful sex differences in age-related metabolic patterns.
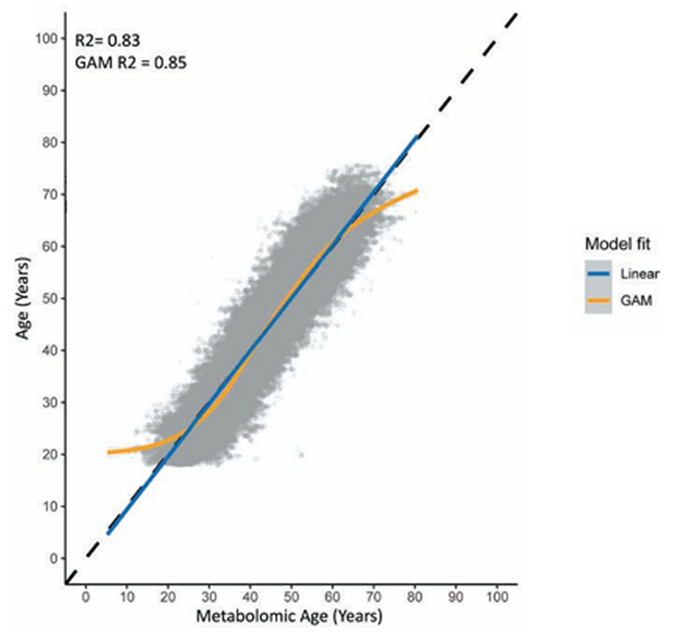
Figure 43. Correlation plot of the Metabolomic age (predicted age) on the x axis and the chronological age on the y axis for all endogenous and xenobiotic metabolites measured. Image reproduced from Faquih et al., J Gerontol A Biol Sci Med Sci, 2025, licensed under CC BY 4.0.
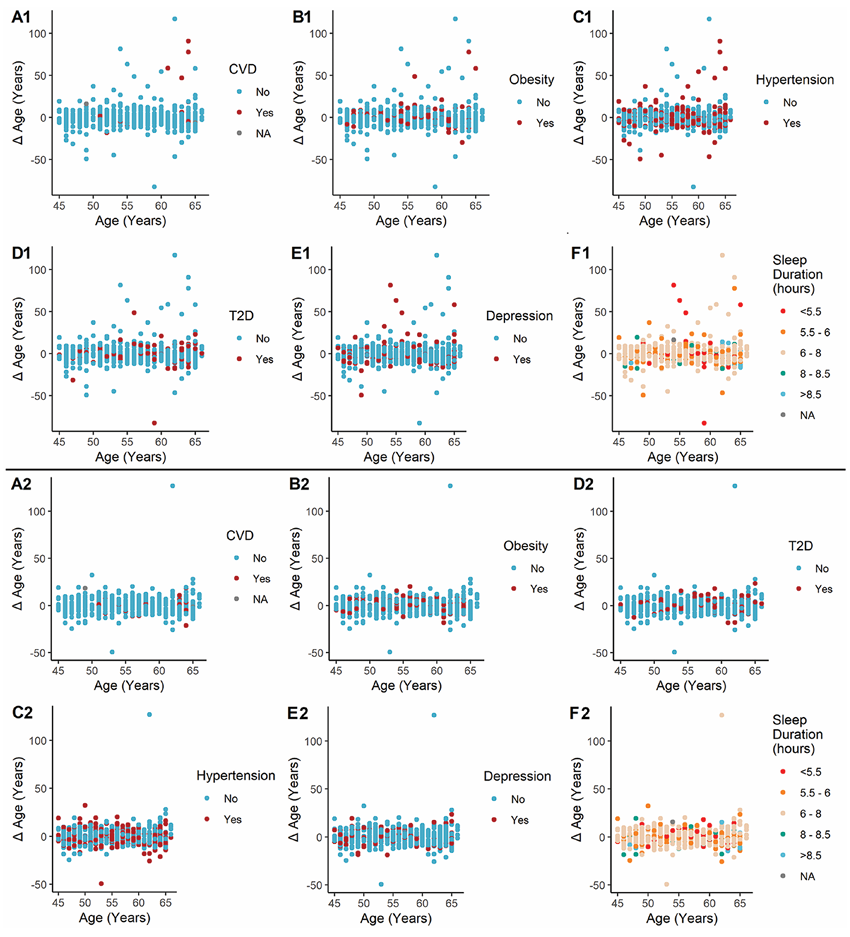
Figure 44. Scatterplots showing the age difference (Δ age) as predicted using the endogenous + xenobiotic metabolites model (A1-F1) and the endogenous metabolites only model (A2-F2). NEO= Netherlands Epidemiology of Obesity. Image reproduced from Faquih et al., J Gerontol A Biol Sci Med Sci, 2025, licensed under CC BY 4.0.
Study Conclusions
- Incorporating a broad range of endogenous and xenobiotic metabolites measured using global metabolomics produced a robust metabolomic age model that outperformed many previous approaches.
- These findings show that metabolomic age prediction models have potential as tools for studying aging biology and identifying individuals at increased risk of age-related diseases.
Linking Heterozygous Pathogenic Variants to Disease Outcomes
Introduction. Although genome-wide association studies (GWAS) of common variants have identified many loci linked to metabolite levels, these variants often have modest effects and do not directly indicate gene function. Rare damaging variants identified through whole-exome sequencing may provide stronger functional insights because substantially alter protein activity. However, most rare variants occur in the heterozygous state, and their physiological consequences are not well understood.
Preliminary Data and Study Goals. In this study, investigators aimed to integrate metabolomics with exome sequencing to systematically determine how rare heterozygous variants influence metabolite levels and human traits, and to determine whether these variants can reveal graded effects on gene function and metabolic pathways [24].
Methods. Untargeted metabolomics and whole-exome sequencing were used to identify associations between metabolites and rare damaging variants. Plasma and urine metabolite levels were measured for a wide range of metabolites in large population cohorts including UK Biobank (UKB) and German Chronic Kidney Disease (GCKD). Rare variant aggregation tests were performed to assess whether groups of rare, predicted damaging variants within a gene were associated with metabolite levels. Computational simulations using genome-scale metabolic network models were used to validate findings.
Results. 235 significant gene-metabolite associations involving rare damaging variants were identified across multiple metabolic pathways, many of which had not been previously reported. These associations highlighted genes that encode enzymes and transporters that influence metabolite concentrations in plasma or urine. Several gene variants with different predicted functional impacts produced graded changes in metabolite levels, which provided evidence of dose-dependent effects on metabolic function (Figure 45). Notably, rare variants in sulfate transporter genes such as SCL13A1 and SLC26A1 were strongly associated with circulating sulfate concentrations and were also linked to height and musculoskeletal traits (Figure 46). Integrating genetic evidence with computational metabolic modeling supported the functional relevance of many associations.
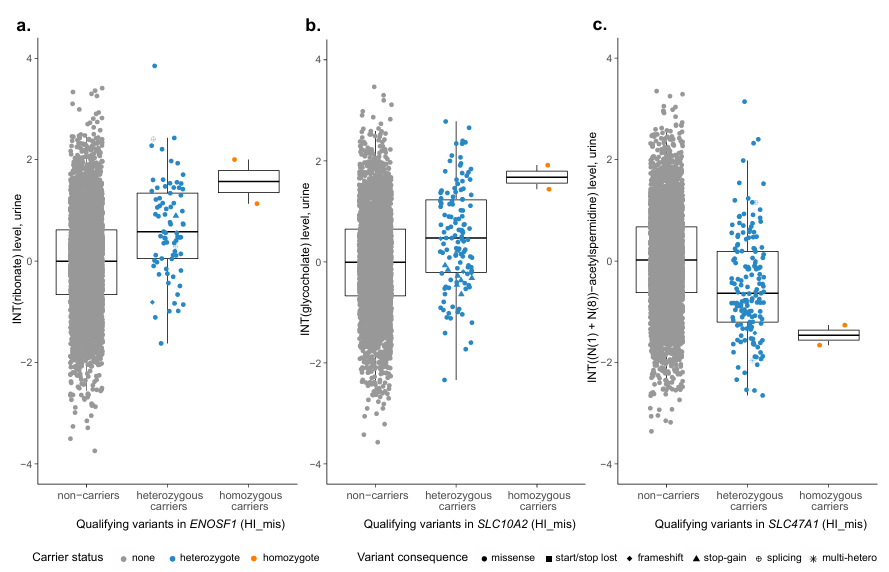
Figure 45. Metabolite levels by qualifying variant carrier status for significantly associated genes with more than one homozygous carrier. Urine metabolite levels after inverse normal transformation and covariate-adjustment are shown on the y axis, among non-carriers and heterozygous carriers of qualifying variants in the HI_mis mask on the x axis. Symbol color and shape indicate a variant’s carrier status and consequence, respectively. Carriers of multiple heterozygous qualifying variants are denoted by as asterisk. Boxes range from the 25th to the 75th percentile of metabolite levels, the median is indicated by a line, and whiskers end at the last observed value within 1.5*(interquartile range) away from the box. The medial levels of ribonate (n=4,618) (A), glycocholate (n=3,753) (B), and (N(1) + (N(8))-acetylspermidine (n= 4,619) (C) are all more extreme for the homozygous than the heterozygous carriers, reflecting a dose-response effect. Image reproduced from Scherer et al., Nat Genet, 2025, licensed under CC BY 4.0.
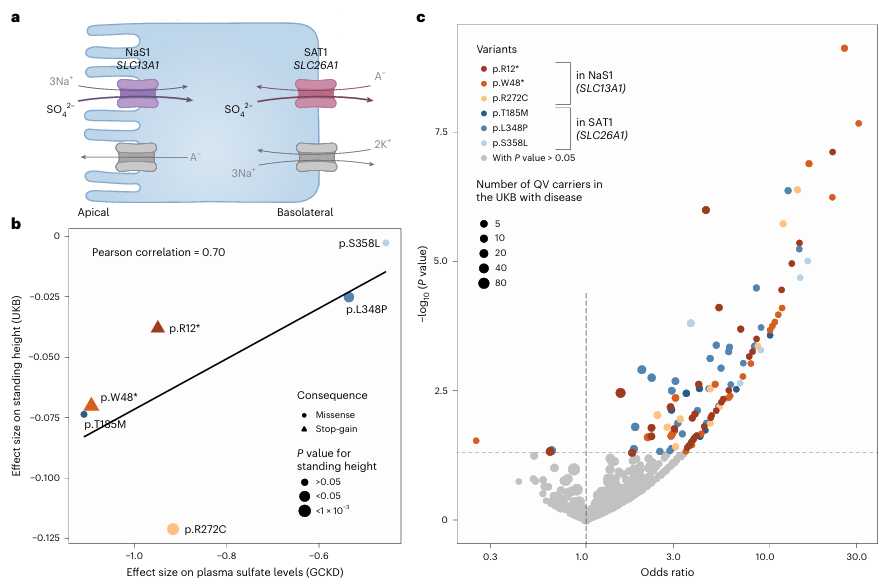
Figure 46. Impact of functional qualifying variants in SLC13A1 and SLC26A1 on height, musculoskeletal traits and fractures supports the role of plasma sulfate as an intermediate readout. (A) Schematic representation of the sulfate reabsorption mechanism involving NaS1 encoded by SLC13A1 at the apical membrane and SAT1 encoded by SLC26A1 at the basolateral membrane of epithelial cells. (B) Scatterplot shows the relation between the effect sizes of six qualifying variants on plasma sulfate levels in the GCKD cohort (x axis) and on standing height in the UKB cohort (y axis). (C) Volcano plot showing odds ratios (x axis) and -log10 (p-values) (y axis) for associations of the six qualifying variants with musculoskeletal diseases and fractures in the UKB. Image reproduced from Scherer et al., Nat Genet, 2025, licensed under CC BY 4.0.
Study Conclusions
- Metabolomics was integral into showing that even heterozygous damaging variants can produce measurable metabolic changes.
- The graded phenotypic effects that were observed show how genetic variation shapes metabolism and human traits.
- Overall, this study’s findings demonstrate the value of metabolomics in gaining a functional readout by which to interpret rare genetic variants and show how combining large-scale metabolic profiling with sequencing can reveal novel insights into the complex link between genetic variation and disease.
Alternative Sample Matrices
Breast Milk
Introduction. Understanding the human milk metabolome can help inform infant nutrition and health, but the high variability of milk composition between individuals and within the same individual over time, making it difficult to define standard concentrations for many components. Previous metabolomics studies have examined variation in milk composition across lactation stages, maternal health conditions, and populations, but relatively few have focused on identifying the core metabolites consistently present across diverse mothers.
Preliminary Data and Study Goals. The goal of this study was to characterize the breast milk metabolome in healthy lactating women from diverse backgrounds in order to define human milk consistently across lactating mothers and identify or substantiate what is crucial for infant nutrition, growth, and development [25].
Methods. Breast milk samples were collected from 31 women who represented diverse racial, ethnic, and dietary backgrounds. Participants also completed a health and lifestyle questionnaire. Milk samples were analyzed using global metabolomics profiling and relationships between metabolic profiles and various maternal or infant characteristics including maternal age, BMI, number of life births, infant age, and lifestyle factors. Metabolic pathways associated with key variables were identified through enrichment analysis.
Results. 389 metabolites were present in all samples. In general, the abundance of these shared metabolites varied widely among study participants. When grouped by biological pathways, xenobiotics showed the greatest variability across the study population, while nucleotides were the least variable. Infant age, maternal age, number of previous live births, and pre-pregnancy BMI were associated with differences in the milk metabolome (Figure 47). Sterol lipids and carbohydrates varied with infant age, as cholesterol and cholesterol sulfate increased as infants grew older. Maternal age was associated with changes in organic oxygen compounds, and the number of live births was linked to variation in organic acids, nucleic acids, carbohydrates, and lipids.
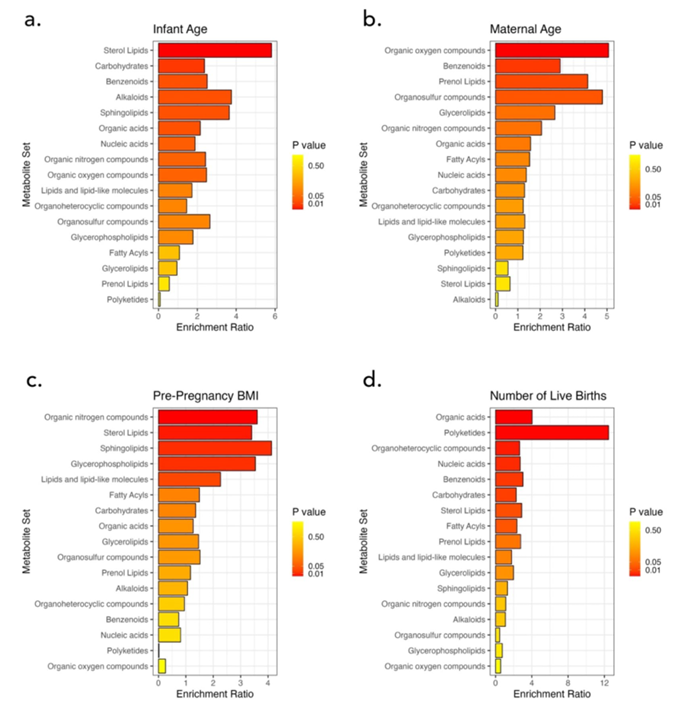
Figure 47. Quantitative Metabolite Set Enrichment Analysis (MSEA) by (A) infant age, (B) maternal age, (C) number of live births, and (D) pre-pregnancy BMI. Image reproduced from Holmes et al., Sci Rep, 2024, licensed under CC BY 4.0.
Study Conclusions
- This study suggests that human breast milk contains a core set of conserved metabolites that likely play essential roles in infant nutrition and psychological development.
- Metabolites involved in fundamental cellular functions, including nucleotides, lactose, creatinine, and glutamate, showed the least variability suggesting that molecules that contribute to critical processes such as energy metabolism are regulated the most tightly.
- This study is another example showing how metabolomics can provide scientific insight on uncommon sample matrices.
Aqueous Humor
Introduction. Aqueous humor (AH) holds valuable molecular information about retinal diseases and can be collected non-invasively, making it a practical source for biomarker discovery and disease mechanism studies. Previous studies have used metabolomics and proteomics to investigate eye diseases including glaucoma, neovascular age-related macular degeneration (nAMD), and diabetic macular edema (DME). However, interpreting molecular data collected from AH can be biased by confounding factors, including variations in total protein concentration and lens status (phakic (eye contains a natural crystalline lens) vs. pseudophakic (natural lens replaced with an artificial lens to treat cataracts).
Preliminary Data and Study Goals. The goal of this study was to determine how these ocular confounding factors impact proteomic and metabolomic profiles of AH, using samples from patients with nAMD and DME with the long-term goal of improving the reliability of AH-based biomarker discovery [26].
Methods. This prospective, cross-sectional clinical investigation included 102 participants with (nAMD), 18 with (DME), and 18 cataract patients without retinal disease as controls. Aqueous humor (AH) samples were collected through anterior chamber paracentesis and frozen for analysis. The Olink Target 96 proximity extension assay platform was used to measure proteins related to inflammatory, metabolic, neurologic, and cardiovascular processes. Total AH protein concentration was measured separately. Metabolites were analyzed using Metabolon’s Global Discovery Panel. Linear models with multiple-testing correction were used to identify differentially abundant proteins and metabolites between groups, while also accounting for potential ocular confounders including lens status, total protein concentration, and exposure to pupil-dilating drugs. Correlation analyses, protein profile clustering, and gene-set enrichment were used to identify biological pathways associated with observed molecular patterns.
Results. AH from patients with nAMD and DME contained significantly higher total protein concentrations than controls. Pseudophakic eyes (artificial lens) had higher AH protein concentrations than phakic eyes (natural lens) and showed increased levels of proteins related to extracellular matrix remodeling and signaling pathways (Figure 48). When adjusted for confounding factors the number of differential proteins between disease groups and controls decreased substantially to reveal disease-associated protein signatures of greater biological relevance. Protein clusters linked to neuronal signaling, antimicrobial peptides, metabolic enzymes, and oxidative stress responses were identified and showed enrichment of proteins previously associated with age-related macular degeneration nAMD and DME. Metabolomic profiles were less affected by these confounders. Metabolomics analysis led to the unexpected discovery that pupil-dilating drops containing phenylephrine/ tropicamide were associated with increased levels of several inflammatory proteins, particularly interleukin-6 (IL-6), likely through the presence of the phenylephrine metabolite 3-hydroxymandelate in AH (Figure 49). Metabolomics also provided insight into disease phenotypes. For example, elevated glucose and fructose and reduced 1,5-anhydroglucitol in DME samples indicated poor glycemic control and chronic hyperglycemia.
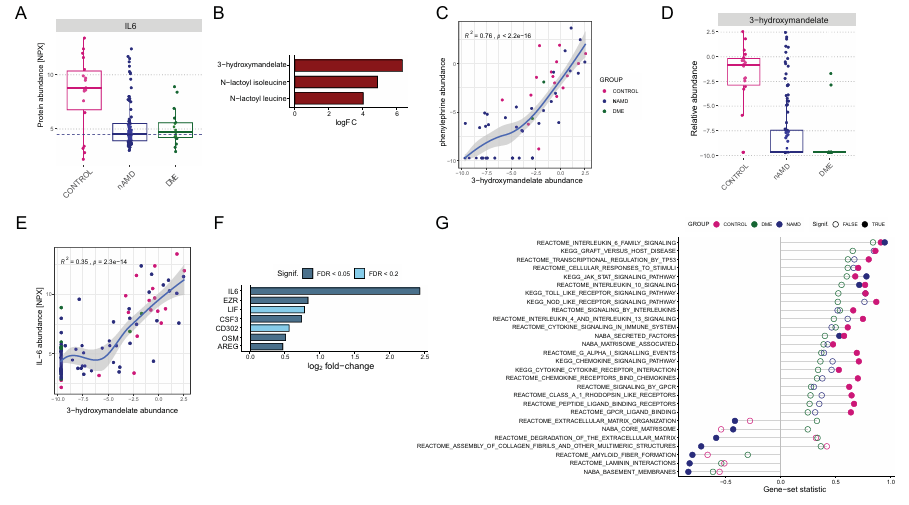
Figure 48. Association of phenylephrine/3-hydroxymandelate exposure with AH protein profiles. (A) Box plots display the relative protein abundance values (NPX) for IL-6 across the three patient groups. The dotted line represents the threshold used to split the control group for subsequent differential abundance analysis. (B) Bar plot of the metabolites significantly associated with high versus low IL-6 levels within the control group (FDR < 0.05). (C) Correlation between 3-hydroxymandelate and phenylephrine levels. (D) Box plots display the relative metabolite abundance values for 3-hydroxymandelate across the three patient groups. (E) As in (C) but for the correlation between 3-hydroxymandelate and IL-6 levels. (F) Bar plot of the proteins associated with high versus low 3-hydroxymandelate levels in the nAMD group, with log2 fold changes indicated and significance levels represented by the color scale. (G) GSEA results for high versus low 3-hydroxymandelate levels in the nAMD group are shown. Image reproduced from Titz et al., Transl Vis Sci Technol, 2024, licensed under CC BY 4.0.
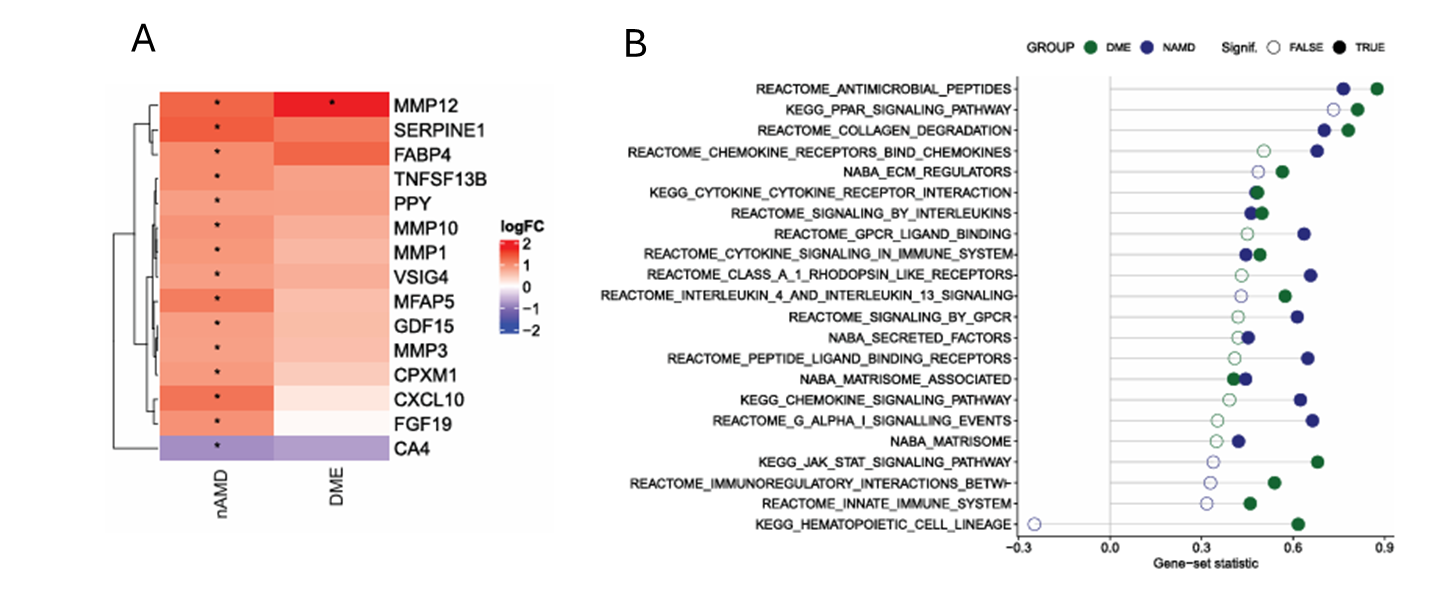
Figure 49. Influence of lens status on aqueous humor protein profiles. (A) Heatmap displaying the differential abundance of proteins, adjusted for protein concentration, between pseudophakic and phakic eyes within the nAMD and DME patient groups. The log2 fold changes are visualized with a color gradient, and proteins with statistically significant differences are marked (*P < 0.05, FDR-adjusted). The heatmap is confined to the top 15 proteins ranked by the absolute value of logFC. (B) Results from GSEA for lens status (pseudophakic vs. phakic) are presented. Image reproduced from Titz et al., Transl Vis Sci Technol, 2024, licensed under CC BY 4.0.
Study Conclusions
- This study’s findings show that proteomic analysis of AH can be strongly influenced by ocular and procedural confounding factors, but metabolomics is less affected by them.
- In this study, metabolomics identified phenylephrine-containing pupil-dilating eye drops as a previously unrecognized confounder. The 3-hydroxymandelate in these drops was associated with increased levels of inflammatory proteins. Not only did this uncover a novel mechanism in eye biology, it also shows that correcting for phenylephrine exposure should be done in future studies to accurately interpret AH omics data.
- This study also serves as an example of how metabolomics can reveal crucial scientific insight from an uncommon sample matrix.
Cervical Swabs
Introduction. The vaginal microbiota plays a critical role in women’s reproductive health. Healthy vaginal environments are typically dominated by Lactobacillus species, particularly Lactobacillus crispatus, which are associated with protective effects, while more diverse, anaerobe-rich microbial communities are linked to bacterial vaginosis (BV). Lactobacillus iners has a paradoxical role in BV because unlike other Lactobacillus species, it is associated with poorer clinical outcomes and increased risk of transitioning to BV, despite being a dominant organism in most women. Standard BV treatment with metronidazole often results in L. iners–dominated communities, which are unstable and prone to relapse. Addressing this clinical challenge requires new strategies that can modulate the vaginal microbiome to result in growth of durable, health-associated microbiota.
Preliminary Data and Study Goals. The biology of L. iners is poorly understood primarily because it is difficult to culture and study in vitro. Compared to other Lactobacillus species, it has a smaller genome and limited metabolic capacity, suggesting reliance on external nutrients. Based on these previous findings, the goal of this study was to identify key metabolic dependencies of L. iners and determine whether this vulnerability could be targeted to shift the vaginal microbiota toward more beneficial compositions and improve treatment outcomes for BV [27].
Methods. Clinical isolates were obtained from a large cohort of South African and American women that contained both BV and non-BV cases. An extensive genome catalog was built from these isolates to enable comparison of metabolic capabilities across microbial species. Cervicovaginal lavage samples were analyzed using global metabolomics and microbiota composition was profiled using 16S rRNA gene sequencing. Statistical analyses were used to correlate metabolite levels with bacterial community structure (e.g., Lactobacillus-dominant vs BV-associated communities).
Results. Findings revealed the growth of L. iners to be uniquely dependent on cysteine. Robust growth of diverse L. iners strains was observed in L-cystine-supplemented culture media, while no growth occurred in L-cystine poor cultures. L. iners was shown to have limited ability to utilize complex cysteine sources, explaining its specific growth requirement and highlighting a key metabolic vulnerability. In clinical samples, cysteine levels were significantly higher in women without bacterial vaginosis (BV) and positively correlated with Lactobacillus abundance, while negatively correlating with BV-associated bacteria (Figure 50). Genomic analyses revealed that L. iners lacks many of the transport systems for cysteine and cysteine-containing molecules that are present in other Lactobacillus species, suggesting that it has limited metabolic flexibility. Cystine uptake inhibitors selectively suppressed L. iners growth without significantly affecting other Lactobacillus species, and in competition
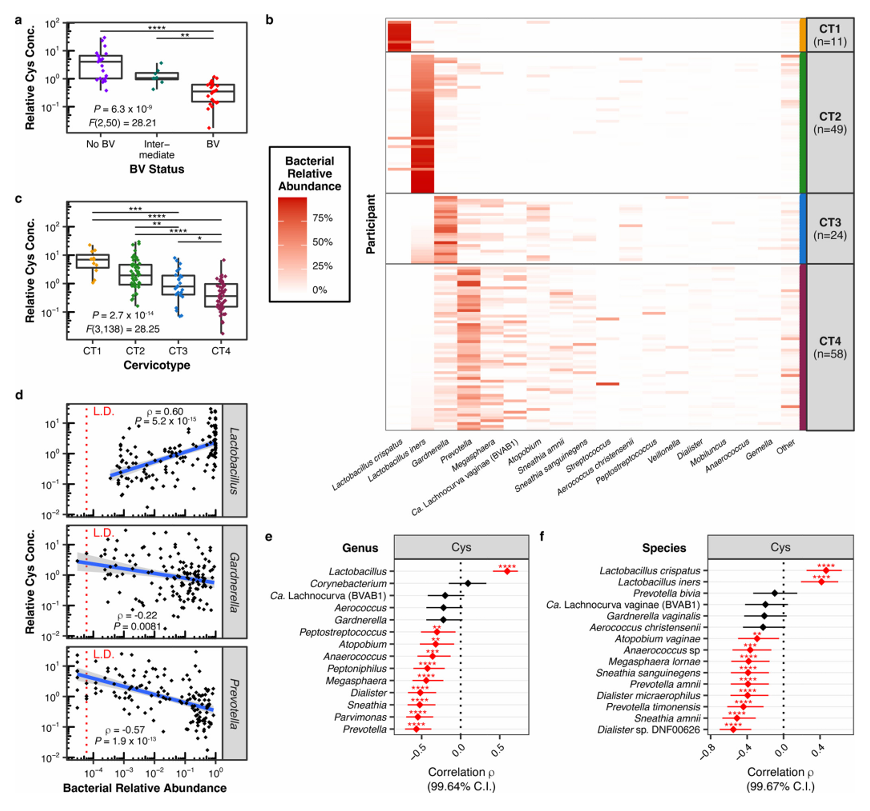
Figure 50. Vaginal cystine (Cys) concentrations are higher in women without BV and correlate with Lactobacillus-dominant microbiota. (A), Relative Cys concentration by BV status in cervicovaginal lavage (CVL) fluid from 53 South African women (21 without BV, 24 with BV, and 8 intermediate). (B) FGT bacterial microbiota composition among 142 HIV-uninfected South African women (including the 53 from A), determined by bacterial 16S rRNA gene sequencing. (C) Relative Cys concentrations per CT in cervical (CTL) fluid from women in (B). (D) Two-tailed Spearman rank correlation between Cys concentrations and bacterial relative abundances of the genera Lactobacillus, Gardnerella, and Prevotella. (E, F) Two-tailed Spearman correlation coefficients (ρ) with adjusted confidence intervals between Cys concentrations and relative abundances of each genus (E) or species (F) detected at >50% prevalence in cohort (n = 142). Image reproduced from Bloom et al., Nat Microbiol, 2022, licensed under CC BY 4.0.
Study Conclusions
- This study identified cysteine dependence as a defining biological feature of L. iners, which offers an explanation regarding the challenges associated with culturing this species.
- L. iners is uniquely limited in its ability to transport and utilize diverse cysteine sources, making it especially reliant on specific forms of exogenous cysteine. This metabolic constraint helps explain its ecological behavior and distinguishes it from more health-associated species like L. crispatus.
- The study findings also suggest that host-derived cysteine levels may influence whether Lactobacillus-dominated or BV-associated communities prevail, suggesting that metabolite availability may be a driver of microbial community structure in the vaginal environment.
- Overall, this study demonstrated proof-of-concept that cystine uptake inhibitors may actively suppress L. iners and enhance effectiveness of metronidazole, suggesting a novel approach to the treatment of BV.
Synovial Fluid
Introduction. Osteoarthritis affects millions of people and contributes substantially to disability. Post traumatic osteoarthritis (PTOA) of the ankle is particularly significant because it often affects younger individuals and can develop years after the initial injury. Despite its prevalence, the early biological processes that drive PTOA remain poorly understood, and the standard of care diagnostic approaches of imaging and clinical exams are insensitive to early disease changes, which limit opportunities for early intervention. Acute joint injury triggers inflammatory responses in synovial fluid, including elevated cytokines, matrix metalloproteinases, and cellular damage, all of which may contribute to cartilage degradation and long-term joint degeneration. Synovial fluid serves as a reservoir of metabolites derived from joint tissues, and prior studies suggest that lipid composition changes with injury, inflammation, and arthritis. However, since earlier work relied on relatively limited analytical techniques, the full metabolic alterations that occur after injury remain poorly understood.
Preliminary Data and Study Goals. The goal of this study was to utilize global metabolomics to identify lipid-related metabolic changes associated with acute injury and early disease processes, with the long-term goal of discovering biomarkers and potential therapeutic targets that could improve understanding and management of PTOA [28].
Methods. The study was a retrospective cohort analysis of patients with unilateral intra-articular ankle fractures requiring surgery. Twenty patients were enrolled, and synovial fluid (SF) was collected from both the injured ankle and the contralateral uninjured ankle at the time of surgery. A subset of seven patients also underwent a second bilateral SF collection 6 months later. Metabolite concentrations were corrected for dilution that occurred during lavage collection by using a urea-based normalization method that compared synovial fluid to serum urea levels. After global metabolomics profiling random forest classification was used to identify key metabolites that differentiated injured ankle SF from control SF. Correlation analyses were performed to identify biological connections between lipid metabolites, inflammatory cytokines, and matrix metalloproteinases.
Results. Long-chain fatty acids, polyunsaturated fatty acids (PUFAs), sphingomyelins, and lysolipids were significantly increased in fractured ankles compared to contralateral controls. Random forest analysis confirmed that fatty acids and lysolipids were the primary drivers distinguishing injured from uninjured joints (Figure 51). Over time, many of these lipid abnormalities showed partial resolution, as several fatty acids and sphingomyelins significantly decreased by 6 months post-surgery. Correspondingly, the ability of metabolomic profiles to distinguish injured from control joints diminished at 6 months, suggesting that the acute metabolic response to injury subsides over time. Lipid metabolites showed strong positive correlations with inflammatory cytokines and matrix metalloproteinases, linking lipid dysregulation inflammation to tissue degradation processes (Figure 52). The magnitude and breadth of lipid changes were associated with injury severity, with more severe fractures showing greater elevations in fatty acids, lysolipids, and related metabolites.
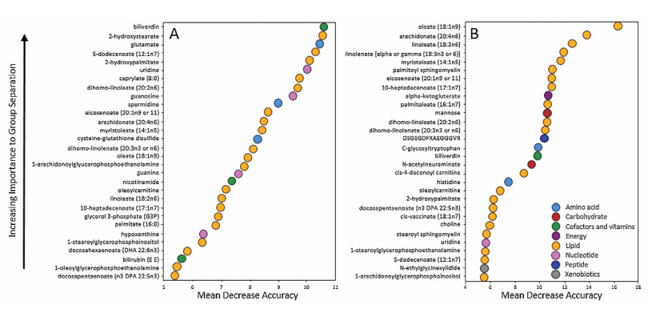
Figure 51. Random Forest classification analysis of Injured versus Contralateral Control at Baseline (A), and Injured Baseline versus Injured 6 months (B). Image reproduced from Leimer et al., J Orthop Res, 2017, licensed under CC BY 4.0.
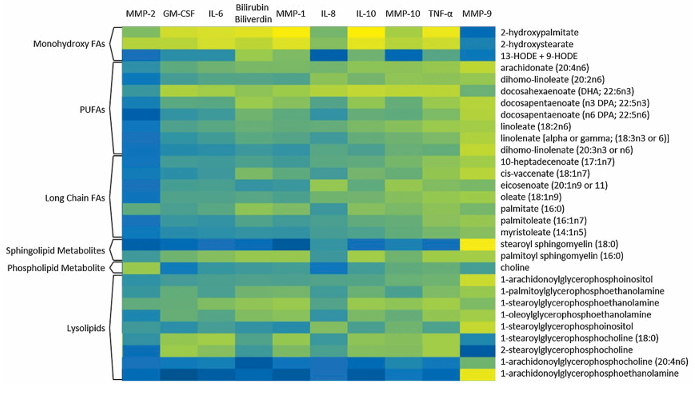
Figure 52. Lipid metabolite correlations with cytokine levels from the same patient cohort. The heat map compartments range from black to blue to yellow, where black represents the weakest correlations and yellow represents the strongest correlations. All significant correlation values were positive. Image reproduced from Leimer et al., J Orthop Res, 2017, licensed under CC BY 4.0.
Study Conclusions
- These study findings suggest that acute intra-articular ankle fracture produces a distinct, injury-driven lipid signature in synovial fluid, marked by elevations in free fatty acids, lysolipids, and sphingolipids.
- The strong correlations between lipid metabolites and cytokines or matrix metalloproteinases suggest that these lipid alterations are closely linked to inflammation, tissue damage, and cartilage degradation in the injured joint.
- Since many injury-induced lipid changes were transient, normalizing by 6 months after surgery, the metabolic response may be part of an acute injury and healing process, and early elevations in these metabolites may also trigger signaling pathways that contribute to long-term joint degeneration and progression to PTOA.
- Lipid metabolites may serve as biomarkers of early joint injury and PTOA risk, as well as potential targets for intervention.
Chapter Takeaways
- Metabolomics can be applied to numerous study designs and a diverse array of topics in basic science research.
- In most cases, metabolomics is fundamental to gaining a key insight or making a crucial discovery that propels research forward and elevates it to a higher level of significance.

Download the complete PDF guide
Download this comprehensive guide developed to teach you the ins and outs of one of the most powerful omics tools in any scientist’s toolbox: metabolomics.
Download nowContact Us
Talk with an expert
Request a quote for our services, get more information on sample types and handling procedures, request a letter of support, or submit a question about how metabolomics can advance your research.
Corporate Headquarters
617 Davis Drive, Suite 100
Morrisville, NC 27560
Mailing Address:
P.O. Box 110407
Research Triangle Park, NC 27709
+1 (919) 572-1711
International Headquarters
Metabolon GmbH
Zeppelinstraße 3
85399 Hallbergmoos
Germany