
Volcano Plot Features

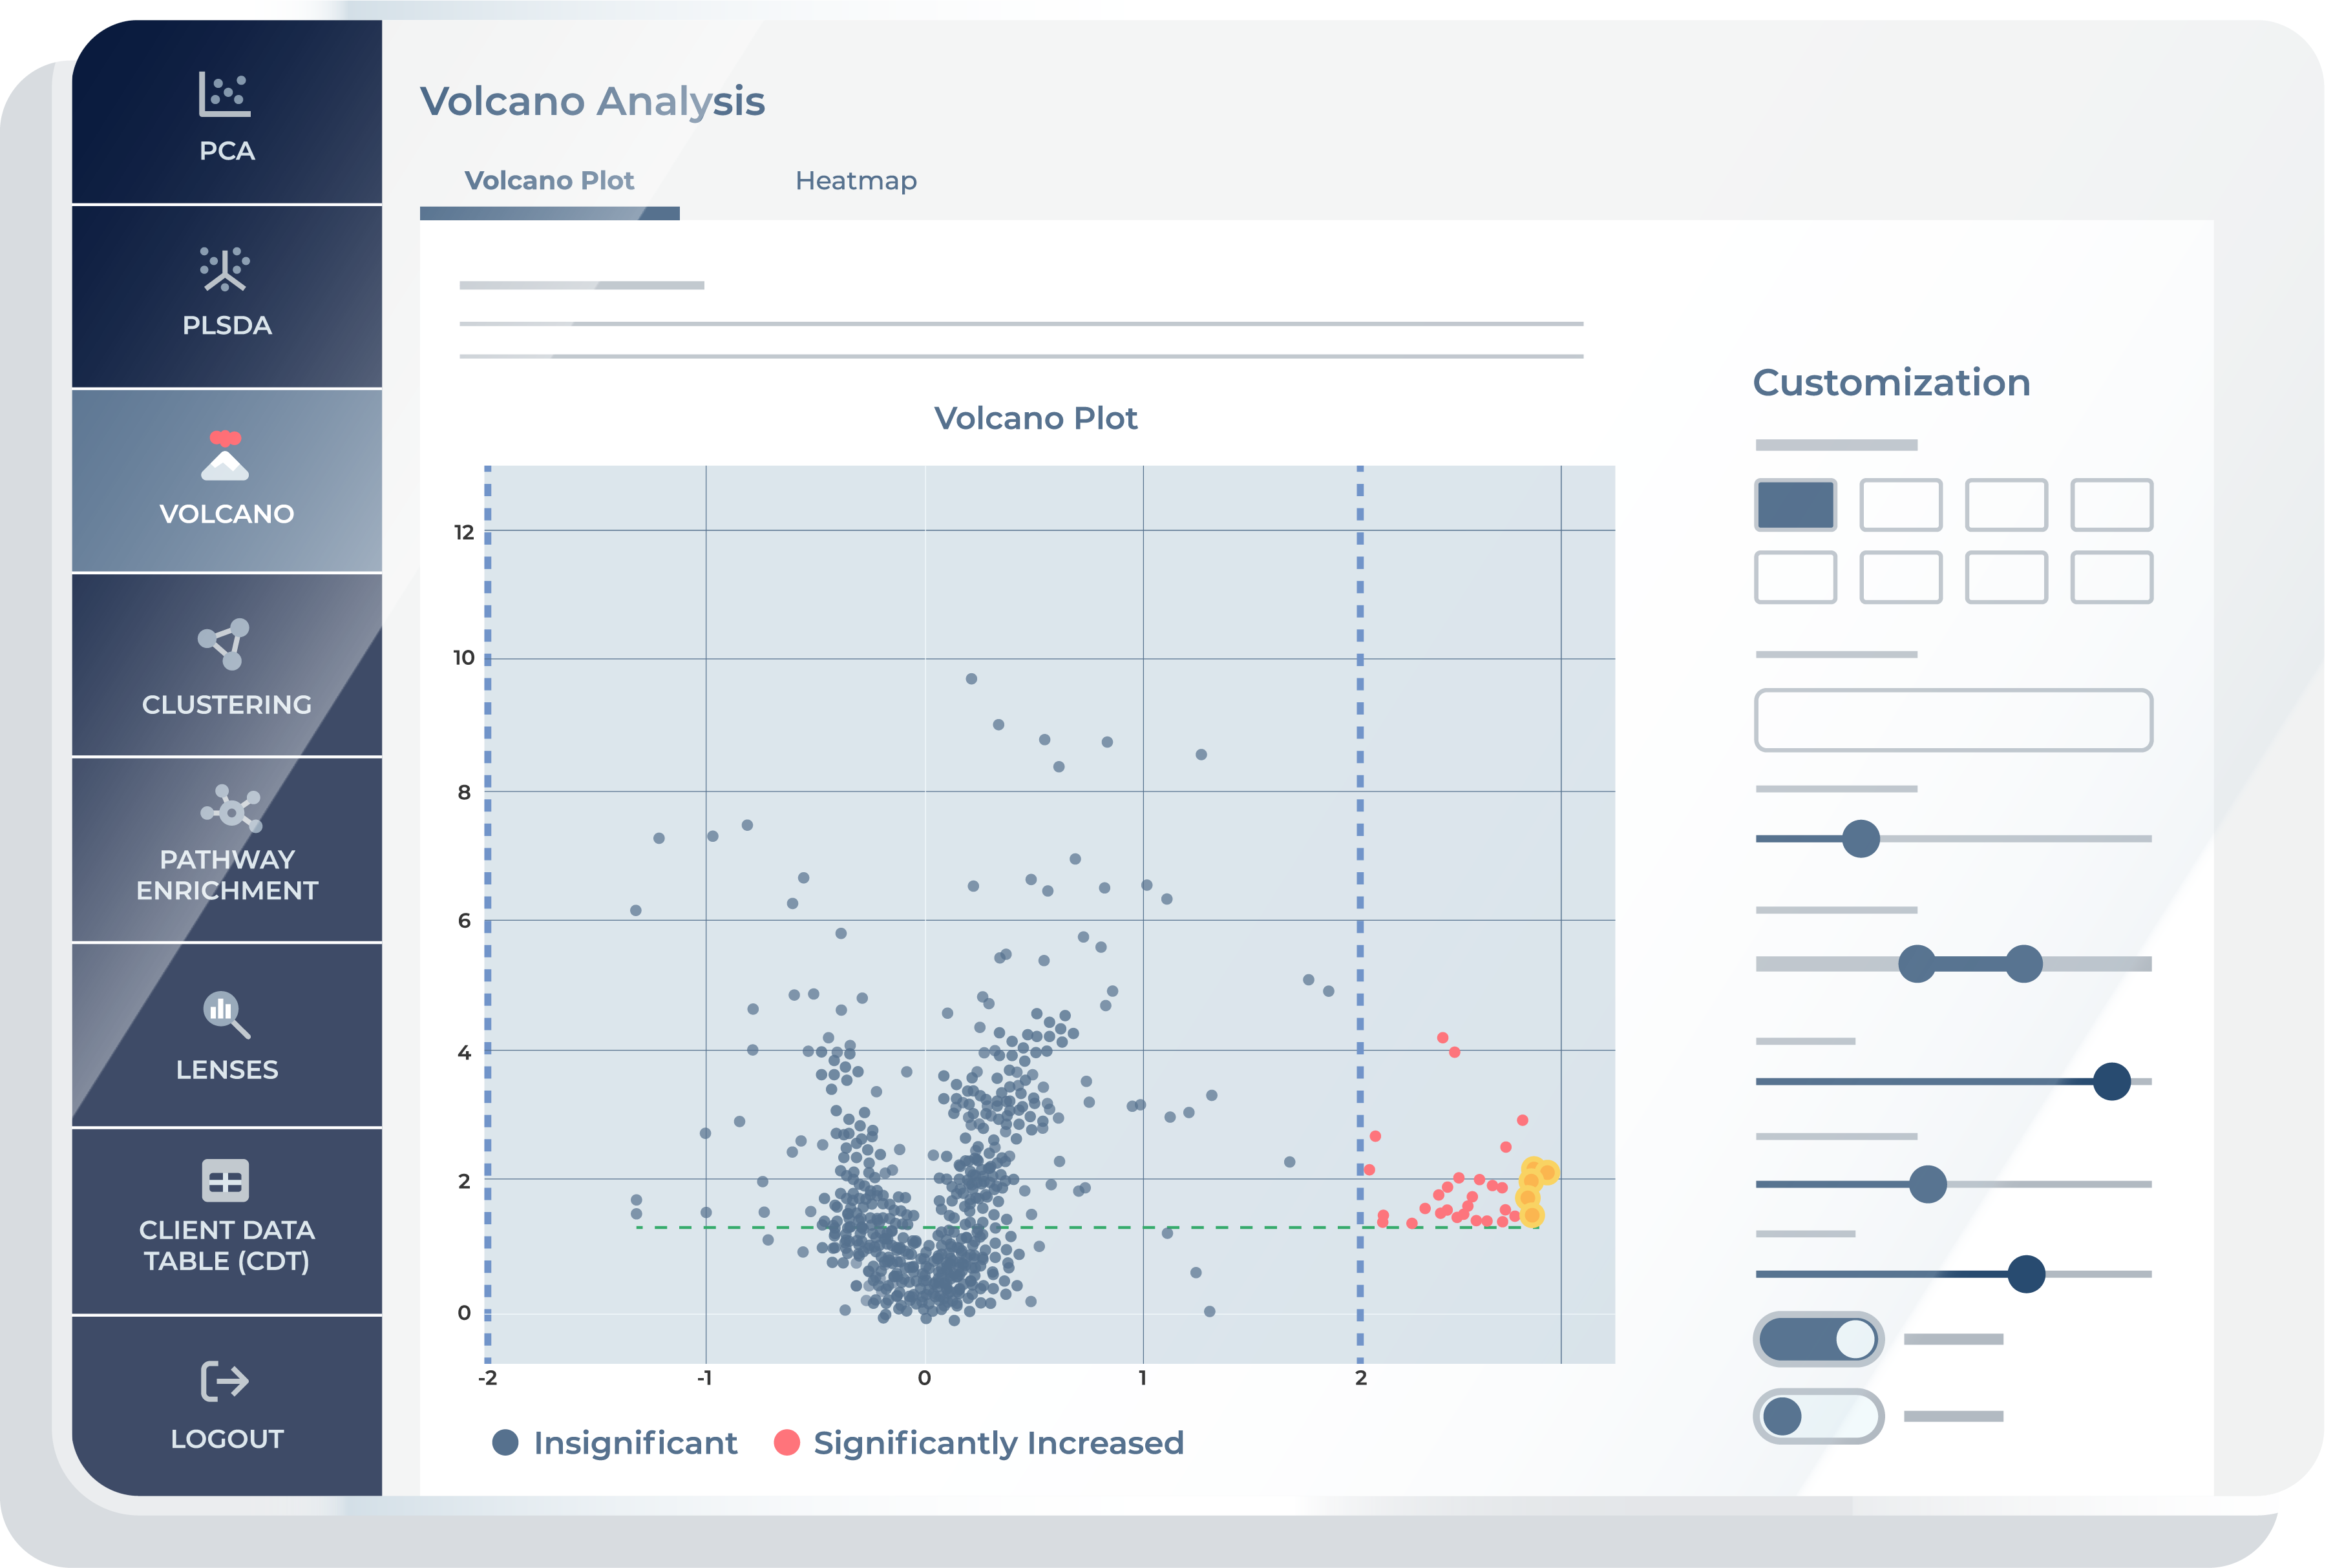
The first feature available in volcano analysis is the ‘Volcano Plot.’ Using this feature, you can access a detailed view of your analysis results, enabling you to visualize data as 2D scatter plots within the context of volcano plot analysis.
These plots effectively display the relationship between the magnitude of change (such as fold change) and statistical significance, helping you to easily identify significant changes in the dataset. This visualization is essential for interpreting complex metabolomic data and for facilitating the identification of key variables of interest in the study.
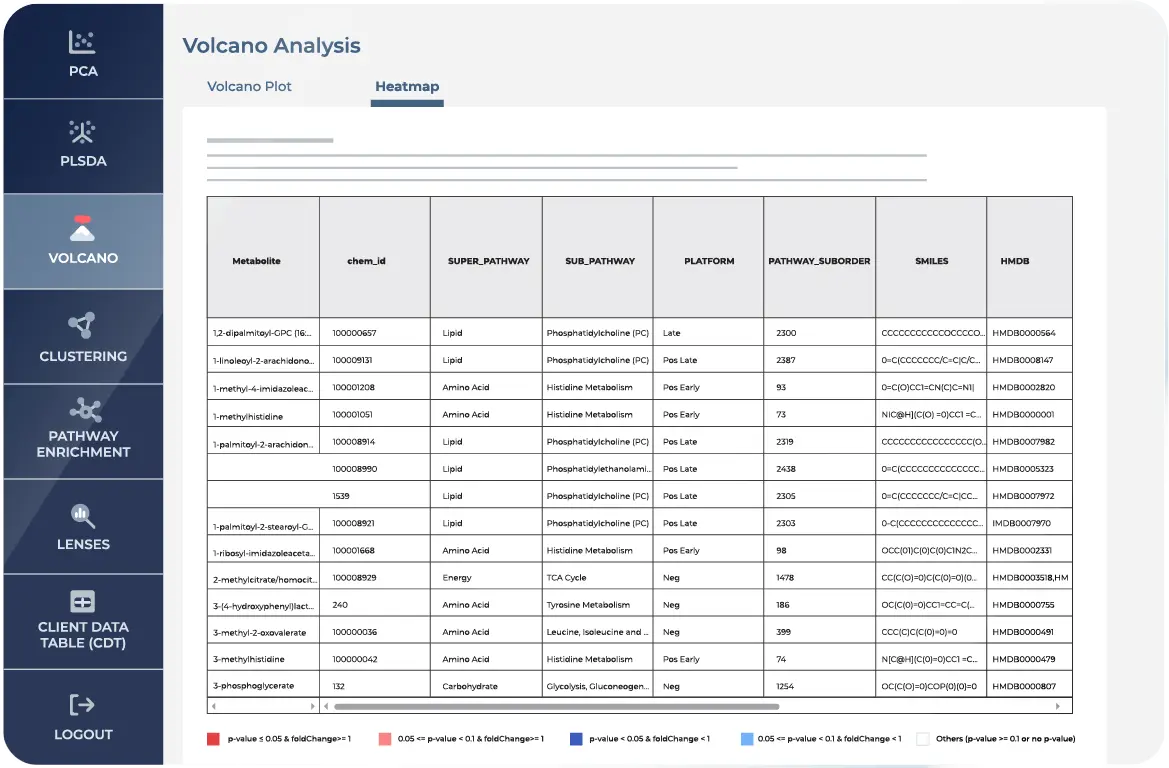
The second feature is a heatmap table for the fold change data and statistical values calculated to produce the volcano plot. This table presents a comprehensive overview of various metabolites, each represented by a dedicated row. For every metabolite, you can compare a range of data types, each detailed in its own column based on your statistical plan. You can choose to view or hide specific columns as per your analysis requirements.
If you would like to focus on specific data sets or make comparisons more discernible, employ the column filtering option. Right-click on your desired comparisons and choose ‘export’ to download only specific parts of the data. The table is designed for intuitive use, ensuring you can swiftly pin columns for easy reference or even export all data with a few clicks. If you hover over a particular cell or column name, you will see a tooltip with more information.
Volcano Plot Overview
The Volcano plot tool is a powerful visualization tool that combines statistical significance with the magnitude of change in metabolite levels to highlight the most biologically relevant metabolites in your study. Metabolon’s volcano plot allows you to download high-resolution graphics that are publication-ready and offer customizable features to meet your specific needs. It allows you to autonomously investigate data in line with your research goals.
Volcano plot has become an indispensable tool in the realm of omics research, providing a powerful visual framework for identifying statistically significant changes in large datasets.1 This type of analysis is particularly relevant in fields like genomics, transcriptomics, proteomics, and metabolomics, where researchers deal with vast amounts of data representing changes in gene expression, protein levels, or metabolite concentrations.
At its core, a volcano plot is a type of scatter plot that displays the results of statistical tests on two axes: the x-axis typically represents the magnitude of change (such as fold change), while the y-axis represents the statistical significance of this change (often shown as the negative logarithm of the p-value). This graphical representation allows for the quick and intuitive identification of data points that exhibit large magnitude changes and are statistically significant, which are often of greatest biological interest.
The name ‘volcano plot’ derives from its characteristic shape: data points with low levels of significance and small magnitude changes form a ‘base,’ while significant changes with large magnitudes rise on both sides, resembling the shape of a volcano. The key features in a volcano plot are the outliers on these ‘sides,’ which represent the most biologically significant changes under study.
Volcano Plot within Metabolon’s Integrated Bioinformatics Platform
The volcano plot tool gives you extensive control to tailor your analysis. This includes adjusting the p-value threshold, selecting key metabolites, and customizing visualizations, thereby facilitating insightful interpretation and hypothesis formation.
Simplifying Complex Data
Volcano plots distil vast amounts of data into a format that is easy to interpret, allowing you to focus on the most relevant changes.
Hypothesis Generation
By highlighting significant changes, volcano plots can suggest new hypotheses about underlying biological mechanisms.
Comparative Analysis
Volcano plots are ideal for comparing conditions, treatments, or time points in an experiment, providing clear visual cues about differences and similarities.
Data Filtering
Volcano plots aid in filtering out noise from meaningful data, emphasizing points that meet both significance and magnitude thresholds.
Customized Control to Tailor Your Analysis
- Customizable Visualizations
A key element of the Bioinformatics Platform is the ability to have as much flexibility to customize visualization as you like. You can personalize your volcano plots with a range of options, from color schemes to font sizes for legends. Statistical significance thresholds can also be adjusted to focus on certain metabolites or metabolite groups. The inbuilt interactive nature of the plots allows for panning, zooming, and selecting individual data points. This feature is especially useful for in-depth analysis and hypothesis generation, as you can color-code and symbolize data points based on specific study groups. - Data Export and Download
To facilitate further analysis and reporting, you can export and download comprehensive data tables, including the dataset underpinning the volcano plot. This feature provides an added layer of convenience.
References
1. Worley, Bradley, and Robert Powers. “Multivariate analysis in metabolomics.” Current metabolomics 1.1 (2013): 92-107.
