Case Study
Severity of presentation in neonates with suspected hypoxic ischemic encephalopathy (HIE) has a dynamic metabolomic profile. Following the initation of therapeutic intervention, metabolite severity profiles evolve over time. These metabolite changes implicate different protein networks with potential implications for patient management and intervention protocols.
Cohort
186 dried blood spots · HIE
Institution
University of Pretoria
Data type
Untargeted metabolomics
Search space reduction
~15,000 proteins → 4–6 candidates

Executive Takeaway
Researchers at the University of Pretoria wanted to understand the drivers of severity in hypoxic ischemic encephalopathy (HIE). Metabolomics was used to profile the biochemical changes in these neonates at two timepoints during the application of therapeutic hypothermia. The metabolite profile revealed that severity in HIE is associated with distinct biochemical changes at different timepoints.
The Splash & Ripple application mapped these changes to protein candidates and provided mechanistic arguments for the observed perturbations. If severity is dynamic, then the appropriate intervention may have temporal implications. Metabolomics paired with Splash & Ripple helped to reveal this dynamic nature of severity in HIE, and the potential mediators involved.
Proof at a glance
186
Dried blood spots
84 at 0–6 hours · 102 at 48–72 hours, during therapeutic hypothermia
93%
Metabolite → protein mapping
An average of 93% of metabolite perturbations across both timepoints could be connected to at least one protein
5
Aligned themes
Themes expected based on the phenotype and supported by the metabolomic data
~15,000
Proteins ranked
Rank based on their relative contribution to the observed metabolite perturbation profile
0.04%
Best candidate rank
CXCL12 ranked 6th of ~15,000 at 48–72 h was the best ranked protein candidate with a reported association to HIE
2
Mechanistic hypotheses
Two mechanistic hypotheses at different timepoints reflect the temporal nature of severity in HIE
The scientific challenge
Metabolomics measures the functional end-state of biology, providing a rich readout of molecular phenotypes. That richness is exactly what makes it powerful and challenging to interpret in isolation.
A severity contrast in HIE returns dozens of significantly altered metabolites. Pathway enrichment will tell you the lipids moved, or the amino acids moved. But enrichment stops at the category. It cannot tell you which enzyme, transporter or regulator sits at the point where several of those compounds meet, and it cannot connect a metabolite in the blood to a signaling protein that never appears on a metabolic pathway diagram at all.
That is a real problem in neonatal encephalopathy. The injury is a cascade: primary energy failure, reperfusion, oxidative injury, inflammation, delayed cell death. Each phase may have different protein drivers. A metabolite list from a single timepoint, read on its own, cannot distinguish which phase you are looking at or whether what you are seeing is damage or the body’s attempt to contain it.
The foundation
Metabolon’s expertly curated Metabolite Affiliated Proteins (M.A.P) database connects named chemical compounds to documented molecular relationships. This comprehensive resource empowers the application to deliver meaningful insights.
The M.A.P database leverages the Reactome database as a foundation. Metabolon has built on this foundation to cover more chemical compounds and curate additional relationships. Of the 2,820 distinct Metabolon library chemical IDs represented in the M.A.P database, only 25.4% have a Reactome (version 92) association. Metabolon’s curated resource contains almost three times more metabolite-protein relationships than Reactome. Results from an internal validation (described in accompanying white paper) at Metabolon revealed that across 131 samples with a diagnosed mendelian disorder, Metabolon’s map recovered 72.5% of diagnostic proteins compared to 57.3% using Reactome alone.
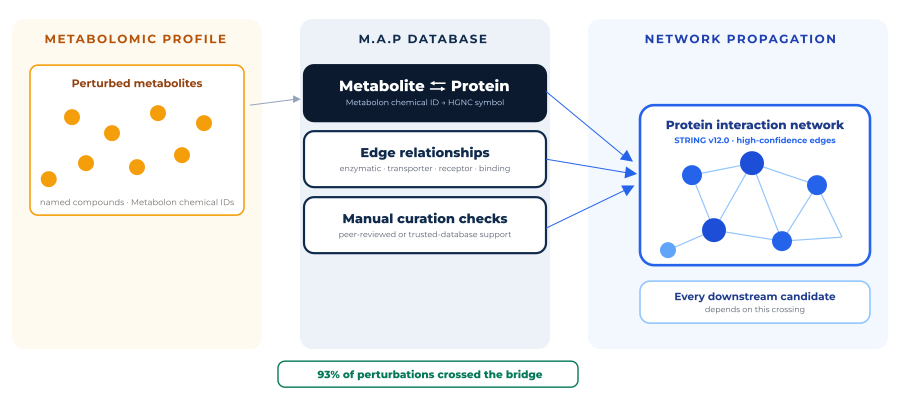
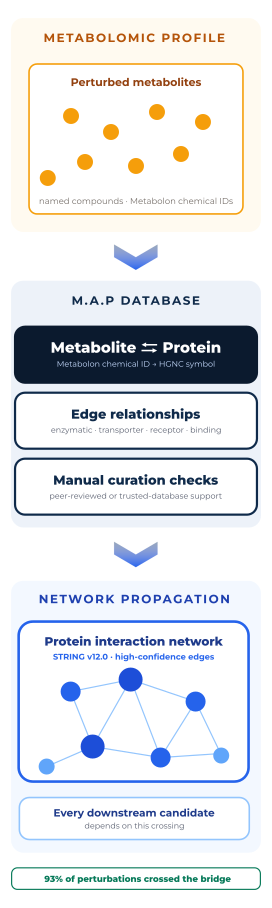
Metabolite-Protein connections. In this study, 93.75% (0–6 h) and 92.79% (48–72 h) of perturbed metabolites mapped directly to at least one protein, and 100% of the top ten perturbations at 48–72 hours.
How Splash & Ripple was applied
Metabolomics measures the consequences of genetic and environmental insults. Splash & Ripple uses expertly curated metabolite-protein relationships to build on the metabolite measurements, leveraging a protein association network to explore neighbourhoods connected to the pattern of perturbed metabolites.
We rarely observe the insult, or the protein it acts on, directly. What we can measure are its metabolomic consequences. Splash & Ripple treats each perturbed metabolite as that measured readout and works backward across the protein network to uncover the biology behind it: the proteins whose altered behavior the metabolite reflects, and the wider neighborhood connected to them. The proteins closest to the readout form the Splash; expanding the network to more proteins with higher degrees of separation gives the Ripple.
Splash & Ripple reduces the manual work of connecting metabolites to protein biology and makes that interpretation more accessible to researchers without specialist expertise.
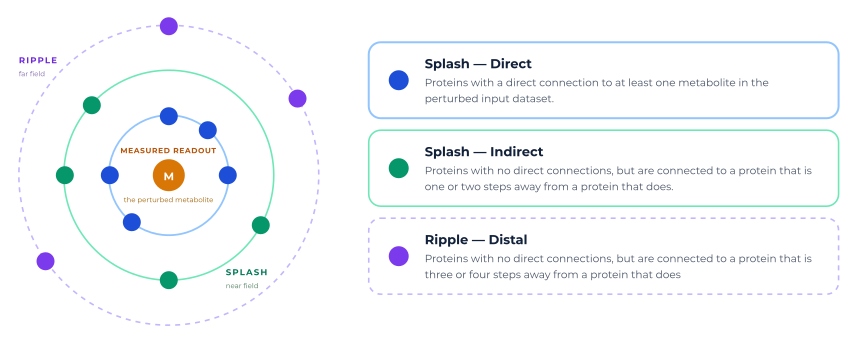
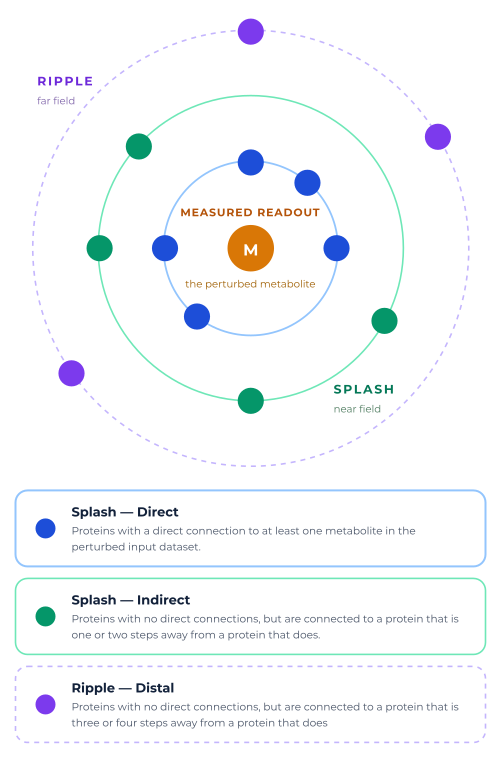
The metabolite is the readout; the proteins are the candidates. At the center sits the measured metabolite. Working outward, Splash & Ripple recovers the proteins behind it and groups them by how close they are to the measured metabolites: directly mapped proteins, near neighbors at one or two interaction steps, and a separate Ripple band reached at three or four steps under stricter criteria. The groups describe network proximity, not causal certainty, and each is scored and ranked on its own terms.
Aligned themes, alongside highly ranked metabolites, can be used to filter the candidate protein list. This approach focuses analyses on discrete biological relationships that can be further explored using Sankey plots to visualize the potential protein-protein network pathways that connect metabolites of interest to a specific protein candidate.
Study and data context
The cohort was assembled at the University of Pretoria as part of the NESHIE study under the direction of Prof. Michael Pepper on behalf of the NESHIE team, with Dr. Caroline Foden as primary genomics and multi-omics researcher. Dried blood spots were collected from neonates diagnosed with HIE at two timepoints over the course of the standard-of-care intervention, therapeutic hypothermia: 0–6 hours (n = 84) and 48–72 hours (n = 102).
Critically, the statistical design was not disease versus health. At each timepoint the analysis compared the most severe presentations against the less severe. Every metabolite entering Splash & Ripple is therefore a severity signal within an already-affected, already-treated population which is far more specific and far more clinically relevant question than “what does HIE look like?”
Because the two comparisons were run independently, they act as a natural internal check on each other. Anything that appears at both timepoints is a persistent feature of severity; anything that appears at only one is time-resolved.

Study design. Two independent severity contrasts, each analyzed separately, giving a time-resolved view of what distinguishes the most severely affected neonates.
Timepoint 1: 0-6 hours (n=84)
Every significantly enriched pathway in the early severity contrast was a lipid pathway.
Lysoplasmalogen metabolism (adj. p = 0.0028) and omega-3/omega-6 fatty acid synthesis (adj. p = 0.0032) led the list, followed by alpha-linolenic acid metabolism, broad fatty acid metabolism and arachidonic acid oxylipin metabolism. Two of these formed aligned themes: ether lipid/plasmalogen remodeling with oxidative stress defense, and PUFA imbalance with oxylipin inflammatory signaling, because oxidative membrane injury and neuroinflammation are exactly what the HIE phenotype predicts.1,2
Applied to the ranked protein table, the two aligned themes intersected with 1-(1-enyl-palmitoyl)-GPE (P-16:0) narrowed roughly 15,000 proteins to 342 and 441 candidates respectively. From those, the analysis surfaced four proteins, and three of them converge on the same axis.
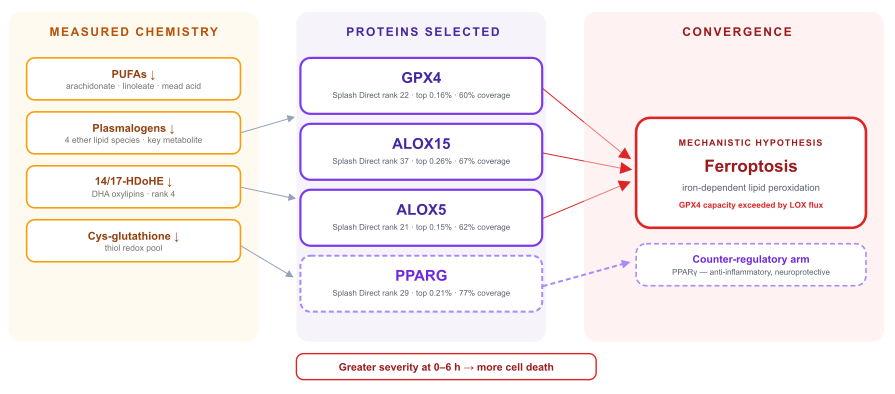
Independent selections, one destination. GPX4, ALOX15 and ALOX5 were chosen from two different aligned themes and different metabolite anchors, yet all three sit on the glutathione–lipoxygenase axis that determines whether a cell undergoes ferroptosis.3–6 PPARG, the fourth candidate, sits on the opposing anti-inflammatory arm.7,8 This kind of convergence is the signal Splash & Ripple is built to expose, and it is not visible in a metabolite list.
The interpretation is coherent with the metabolomics: lipoxygenases consume polyunsaturated fatty acids to generate hydroperoxides; GPX4 uses glutathione to reduce them.4,5 If GPX4 capacity is exceeded, peroxidation propagates and the cell dies by ferroptosis.3,6 The measured profile shows substrate falling, plasmalogen antioxidant capacity falling, and the glutathione-linked pool falling all at once, and all more strongly in the most severe neonates.
Timepoint 2: 48-72 hours (n=102)
Not one lipid pathway reached significance in the later contrast. The enrichment profile had moved to amino acids, nucleotides, nicotinate and nicotinamide metabolism, tryptophan, and ascorbate.
Three aligned themes emerged, each mapping onto a recognized phase of the encephalopathy cascade: excitotoxicity and amino acid neurotransmitter imbalance,9 mitochondrial energy failure with NAD⁺/ATP disruption,10,21 and oxidative stress with antioxidant depletion.11 And the analysis anchored all three on a single compound.
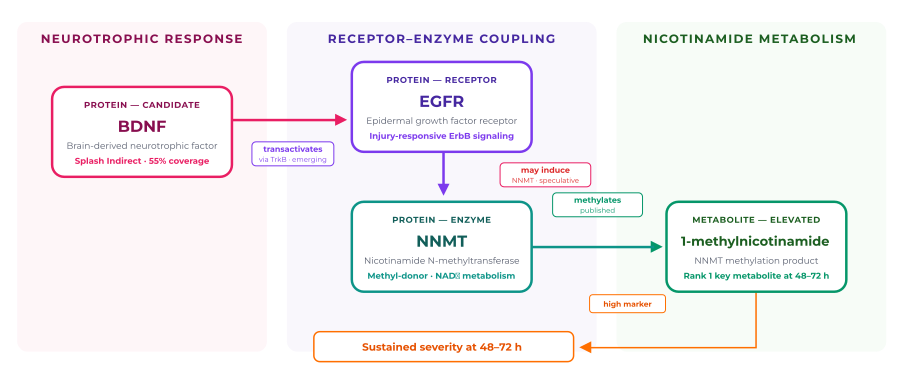
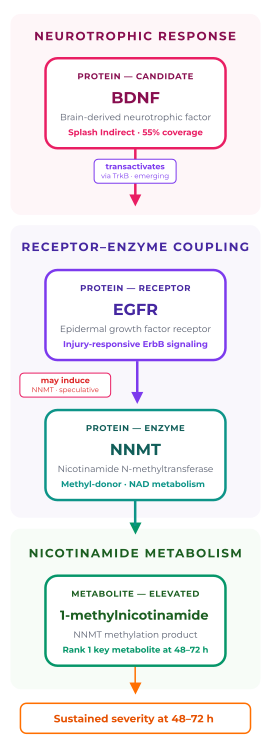
A path chosen and interrogated. Having ranked BDNF in Splash Indirect and 1-MNA as the top key metabolite, the analyst selected this specific protein–metabolite connection in the Sankey view and asked Splash & Ripple to reconstruct the intervening path. Each step is returned with an explicit evidence grade — published, emerging, or speculative — so the hypothesis can be evaluated rather than simply accepted.
Absent from the key metabolite profile at 0–6 hours. At 48–72 hours it is the highest-ranked compound to satisfy every key-metabolite criterion: significantly pathway-associated, not a xenobiotic, tractably connected, and it is significantly elevated in the most severe cases.
Nicotinamide itself is down. Its methylated product 1-MNA is up. 1-MNA’s own downstream catabolite, N1-methyl-2-pyridone-5-carboxamide, is up. NAD⁺ and NMN are up. Cortisol is elevated at rank 5.
Together, these changes are consistent with increased engagement of the nicotinamide methylation and clearance pathway.
Brain-derived neurotrophic factor is the brain’s principal pro-survival, pro-repair signal, and it is directly relevant to the biology flagged here: it counters glutamate excitotoxicity, the exact mechanism behind this timepoint’s excitotoxicity aligned theme, and enhancing BDNF/TrkB signaling is neuroprotective in neonatal hypoxia–ischemia models.12,13
BDNF is a promising biomarker in this clinical space, but it is not yet clear how to read it. Studies have linked both elevated and reduced circulating BDNF to worse encephalopathy severity or outcome, and the direction appears to depend on sampling time, matrix and treatment context.14–17 If the relationship to prognosis remains unsettled when BDNF is considered alone, placing it inside a network with other severity-linked metabolites and proteins may help clarify how the signal should be interpreted, or point toward alternative markers that travel with the same biology.
That is what makes the BDNF–1-MNA connection interesting. The link is not one-directional: 1-MNA has been reported to restore hippocampal BDNF signaling and produce TrkB-dependent effects in an independent model.18 So the elevated 1-MNA seen in the most severe neonates and the brain’s neurotrophic repair program may be coupled rather than separate stories. This remains a conjecture, but importantly it is a specific, testable one.
NNMT transfers a methyl group from S-adenosylmethionine to nicotinamide, producing 1-MNA.19 Elevated 1-MNA is therefore a readout of NNMT flux: a recognized stress-responsive adaptation with anti-inflammatory and vasoprotective properties.19,20 Read on its own, the elevation looks protective.
But the samples were taken 48 to 72 hours after therapeutic hypothermia, and it is the most severe neonates in whom 1-MNA is highest. A compensatory response that is still active may imply that the insult is ongoing, or that the compensation is insufficient to prevent further damage.
(Scroll left/right to see full table)
| Candidate | Tier | Rank / percentile | Metabolite coverage | Why it was selected |
|---|---|---|---|---|
| CXCL12 | Splash Direct | 6 · top 0.04% | 36% | CXCL12/CXCR4 signaling limits ROS-mediated damage; transiently upregulated after neonatal hypoxic–ischemic injury |
| APP | Splash Direct | 14 · top 0.09% | 50% | Regulates glutamatergic signaling; rapidly induced after neonatal HI injury |
| CCR2 | Splash Direct | 18 · top 0.12% | 31% | Induced by excitotoxic injury; mediates monocyte-driven inflammatory damage |
| CXCL8 | Splash Direct | 24 · top 0.16% | 42% | IL-8 is elevated in newborns with HIE and correlates with injury severity |
| ENPP1 | Splash Indirect | 2,518 · top 16.5% | 42% | Hydrolyzes extracellular ATP and NAD⁺-derived ADPR, modulating adenosine signaling |
| BDNF | Splash Indirect | 2,526 · top 16.57% | 55% | Counters glutamate excitotoxicity; promising neurotrophic biomarker in HIE whose direction remains unsettled — analyst-selected for path reconstruction to 1-MNA |
CXCL8 acts like an internal control: interleukin-8 is an established plasma biomarker of HIE severity in newborns16. The modest rank of BDNF demonstrates that multiple features, apart from raw rank, are considered during lead selection.
The Results

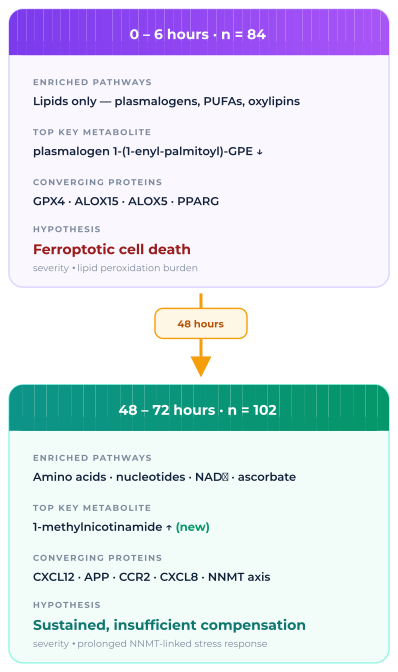
If severity in HIE is fluid, i.e., it looks different at different timepoints, implicating different systems, proteins, pathways, then this has repercussions for intervention management. The first step towards addressing this challenge is a full understanding of this temporal evolution of severity. Metabolomics paired with the Splash & Ripple application is one method to profile and contextualise how severity in HIE evolves over time as a step towards better patient management protocols.
The value of the approach
Splash & Ripple helps researchers move from metabolite measurements to network-informed hypotheses.
Metabolomics revealed two sets of statistically significant compounds implicating divergent drivers of severity at different timepoints. Splash & Ripple provides greater context to each severity signal, and proposes mechanistic hypotheses for a selection of the observed changes.
By placing metabolomic data within the larger context of protein biology, researchers have an increased opportunity for idenitfying targetable biology. For example, GPX4 is a key regulator of ferroptosis, and understanding its activity in the early severity profile and any pressures acting on its capacity could ultimately inform novel or revised intervention strategies.
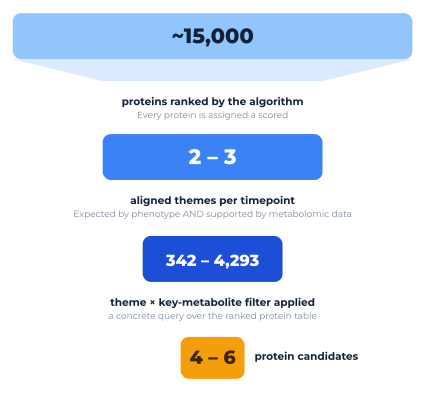
Search-space reduction. Nothing is thrown away. Every protein retains a rank and can be revisited, but the researcher’s attention is directed to a handful of explainable starting points instead of a whole proteome.
Observed
Measured evidence
The metabolomic profile.
Inferred
Network position
The selected protein candidates and their relative rank based on their relationship to the metabolomic profile.
Hypothesis
Untargeted metabolomics
The relationship between individual protein-metabolite pairs is rationalised within the context of the study phenotype. Reasonable arguments are proposed for consideration.
Limitations and next steps
Splash & Ripple generates hypotheses. It does not generate proof, and the outputs are explicitly built to make that distinction legible.
Splash & Ripple
Metabolon’s Splash & Ripple workflow works backward from metabolomic readouts, connecting perturbed metabolites to the proteins most likely to explain observed biological responses.
Turn your metabolomic results into prioritized protein candidates, explicit mechanistic hypotheses, and a clearer path toward experimental validation.
Fill out the form to speak to an expert about leveraging Splash & Ripple for your next study.